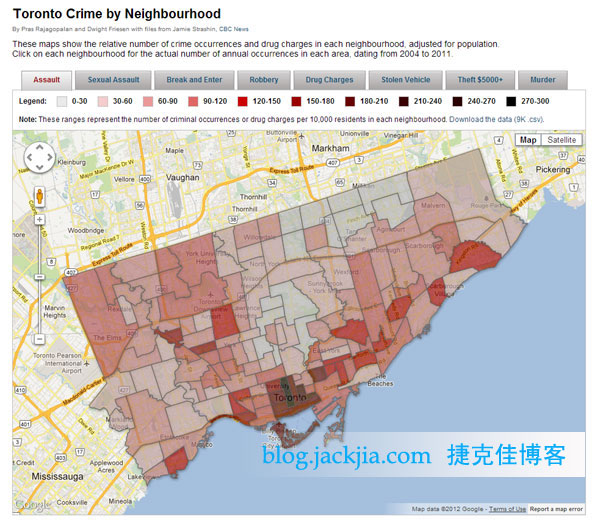
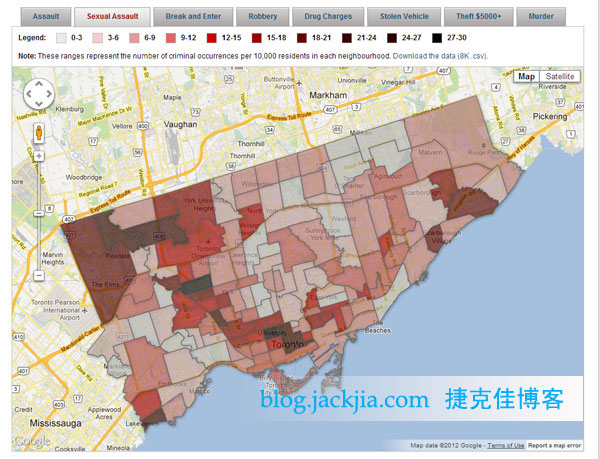
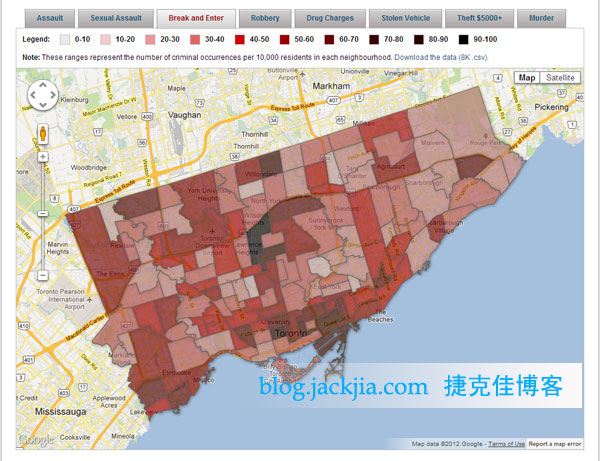
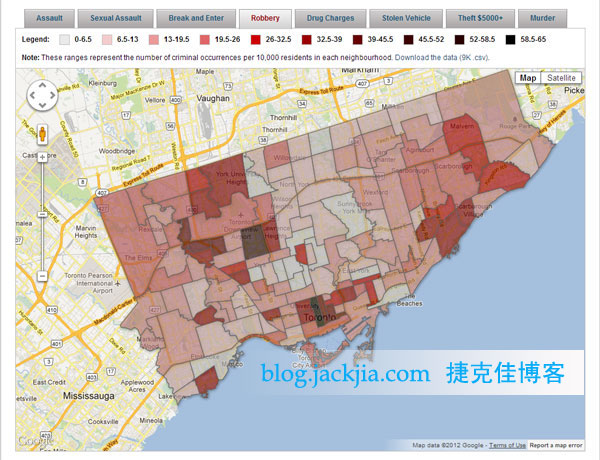
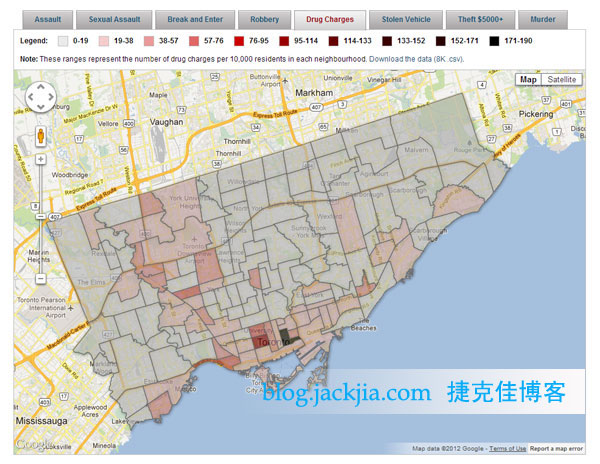
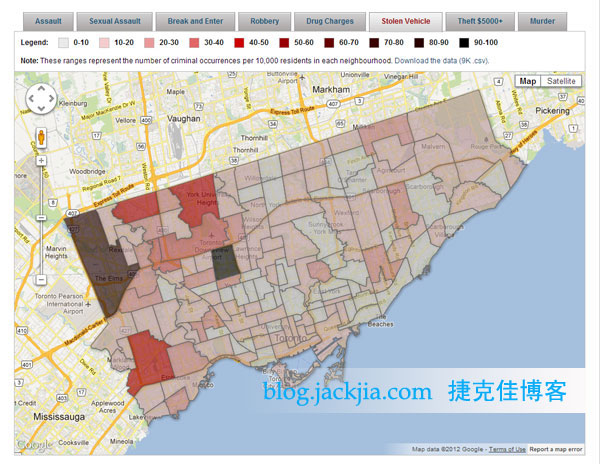
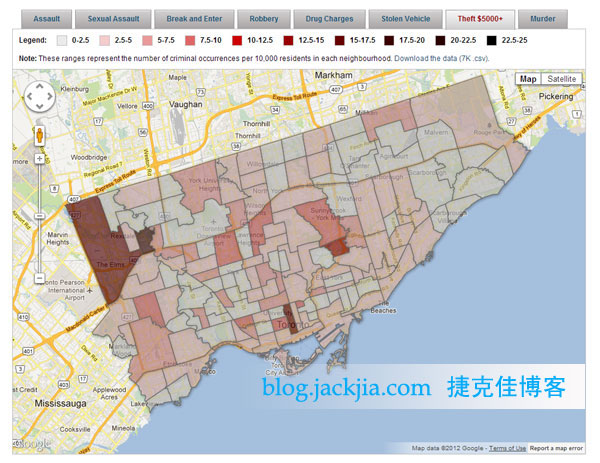
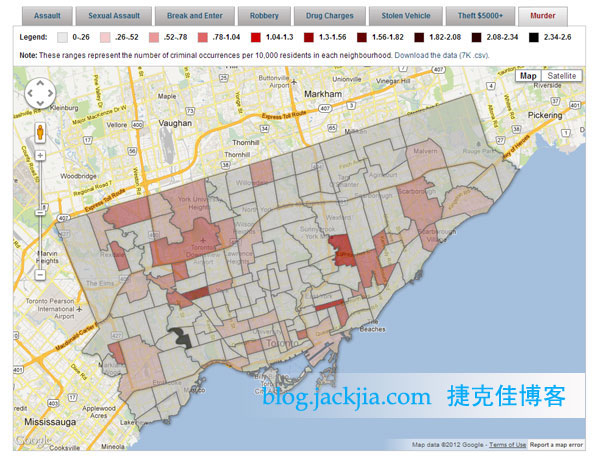
世界日报/多伦多警察局的数据显示,多伦多犯罪热点似乎集中在多伦多市中区和多伦多西北地区。
多伦多警察局编撰了过去七年的多伦多140个社区犯罪数据。警方依照攻击他人案(assaults)、性侵案、入室盗窃案、打劫案、毒品案、汽车偷盗案、盗窃超过5000元案和凶杀案对数据进行分类。
根据2011年的人均犯罪比率(per capita criminal occurence)来算,多伦多市中区的犯罪率在140个社区中名列榜首或接近榜首,譬如,卑街地段(Bay St)是多伦多人均攻击他人案和打劫案发生最多的地区,该地段的人均毒品案在多伦多排名第三;多伦多市中区东端的摩斯公园社区(Moss Park)人均毒品犯罪案、攻击他人案、入室盗窃案和性侵案在多伦多分别排名第一、第二、第四和第七;大学社区(University neighbourhood)的人均性侵案、毒品案、打劫案、攻击他人案和入室盗窃案分别排名第二、第三、第七、第八和第八。
多伦多西北部的布鲁安斯社区(Brookhaven-Amesbury)人均性侵案排名多伦多第一,而多伦多中部的贝帕诺社区(Bedford Park-Nortown)人均入室盗窃案排名多伦多第一。
多伦多西北部的艾欧瑞社区(Elms-Old Rexdale)人均盗窃5000元以上案排名多伦多第一,而多伦多中部的约格公园区(Yorkdale-Glen Park)人均汽车盗窃案排名多伦多第一。
Crime hot spots in Toronto revealed in online map
CBC News Posted: Oct 29, 2012
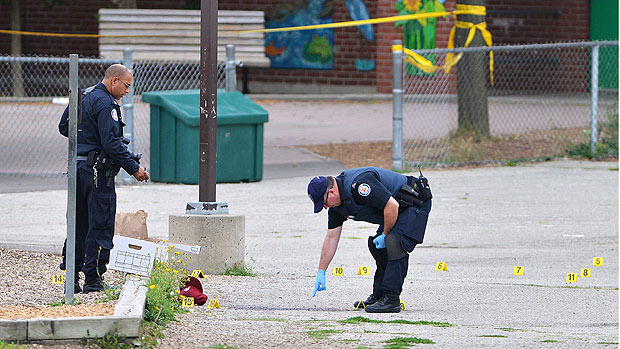
Detailed crime statistics for all of Toronto’s 140 neighbourhoods are available on CBC’s neighbourhood crime map. (Aaron Vincent Elkaim/Canadian Press)
Crime hot spots in Toronto appear to be concentrated around the city core and the northwest, police data obtained by CBC News suggests.
The crime data for 140 Toronto neighbourhoods over the last seven years has been plotted onto an interactive map by CBC News. Data has been organized into the following categories: assaults, sexual assaults, break-ins, robberies, drug charges, stolen vehicles, thefts over $5,000 and homicides.
Across the board, downtown neighbourhoods have come in at or near the top of the list when it comes to the number of per capita criminal occurrences in 2011.
The Bay Street corridor, for instance, has the most per capita assaults and robberies in Toronto, and ranks third out of 140 neighbourhoods for most drug charges per capita.
Moss Park, on the eastern edge of the downtown, is ranked:
-First for per capita drug charges.
-Second for per capita assaults.
-Fourth for per capita break-ins.
-Seventh for per capita sexual assaults.
The university neighbourhood, meanwhile, is ranked:
-Second for per capita sexual assaults.
-Third for per capita drug charges.
-Seventh for per capita robberies.
-Eighth for per capita assaults.
-Eighth for per capita and break-ins.
Brookhaven-Amesbury in the northwest ranked highest for per capita sexual assaults, while Bedford Park-Nortown in central Toronto had the most per capita break-ins.
Elms-Old Rexdale in the northwest had the most per capita thefts over $5,000, while Yorkdale-Glen Park in central Toronto had the most per capita vehicle thefts.
Police advise caution when interpreting data
Toronto police spokesman Mark Pugash said it’s important to treat the numbers with caution, saying they have limitations and that police look at a number of different variables before determining how and where to deploy resources.
“What [police] look for is a much larger picture. We’ll look at the history, the trends, criminal intelligence, demographics, a wide variety of factors before we come up with conclusions about what it all means,” he said.
He also said there is a “slight risk” in calculating per capita criminal occurrences for neighbourhoods, as CBC News has done on its neighbourhood crime map.
“Because I think most people accept that in this city, during the day and at night and at weekends, there is a much greater influx of people from outside the city that elevates the numbers,” he said.
“So if you go on Toronto population [numbers], you’re missing all those people who come from the GTA — who come in for the entertainment district, who come in for sports events, who come in for large cultural events and other things.”
Some of the assaults and other criminality that occur in the downtown may be a result of the relatively high concentration of bars and nightclubs in the downtown core.
Dr. Glen Bandiera, the chief of emergency medicine St. Michael’s Hospital, located just east of Yonge Street and north of Queen Street East downtown, confirms that the emergency room sees an increase in personal injuries from Thursdays to Saturdays, generally late at night or early in the morning.
Many of the injuries in those hours “are consistent with interpersonal conflicts,” such as punches, kicks and assaults with blunt weapons, said Bandiera, who added his department also provides care for a significant homeless population.
He said an increase in the number of people moving into the downtown in recent years may have something to do with an increase of about 10 to 11 per cent of people being admitted to the emergency room at his hospital each year in the last two to three years.
The population of the waterfront communities — on the Island, for instance — has jumped 133 per cent between 2006 and 2011. The population of the Bay Street corridor has jumped 37.7 per cent in that same period.
“One could argue that the process of more people trying to get into fewer clubs actually causes problems, because people are frustrated and they find other ways to vent their frustration,” he said, adding alcohol and drugs “are big players in a lot of the assaults.”
Adam Matthias, who works in the Bay Street area downtown, said he was surprised at some of the downtown crime numbers.
“It’s only as safe as you make it. If you’re going to go into a dark alley … you’re going off the beaten path, whereas Bay Street? I’m happy.”
Alex Balch, in the George Street area in the Moss Park neighbourhood, said it’s more important to change the causes of crime than focus on statistics.
“Really, the root cause of it is, like, a very concentrated level of poverty and homelessness and lack of housing and then substance abuse.”
http://www.cbc.ca/news/canada/toronto/story/2012/10/26/toronto-crime-hotspots-map213.html
10 neighbourhoods for most per capita crime in 2011
CBC News Posted: Oct 24, 2012
Compiled below are lists of the 10 neighbourhoods with the most number of criminal occurrences per 10,000 residents for each category in 2011. More details on the crime information can be found in the methodology section.
Lists of the top 10 neighbourhoods with the least number of criminal occurrences per capita are available here.
Assaults
Rank Name Assaults per 10,000 residents
1
Bay Street Corridor 285.9
2 Moss Park 227.7
3 Waterfront Communities-The Island 206
4 Kensington-Chinatown 199.5
5 Church-Yonge Corridor 188.6
6 North Riverdale 186.7
7 Beechborough-Greenbrook 178.7
8 University 169
9 South Parkdale 156.6
10 Weston 153
Sexual assaults
Rank Name Sexual assaults per 10,000 residents
1
Brookhaven-Amesbury 29.3
2 University 27.1
3 Bay Street Corridor 24.3
4 Thistletown-Beaumond Heights 23.7
5 Glenfield-Jane Heights 22.9
6 Mount Olive-Silverstone-Jamestown 22.9
7 Moss Park 22.1
8 Long Branch 21.8
9 Weston-Pellam Park 21.6
10 Humbermede 21.4
Break and enters
Rank Name Break and enters per 10,000 residents
1
Bedford Park-Nortown 94.2
2 Kensington-Chinatown 89.8
3 Lawrence Park South 72.4
4 Moss Park 71.2
5 South Riverdale 70.9
6 Newtonbrook East 70.6
7 University 68.4
8 Greenwood-Coxwell 68.3
9 Oakridge 67.4
10 Bay Street Corridor 66.6
Robberies
Rank Name Robberies per 10,000 residents
1
Bay Street Corridor 64
2 Yorkdale-Glen Park 55.1
3 Pelmo Park-Humberlea 44.6
4 Church-Yonge Corridor 43.7
5 Rustic 41.3
6 Moss Park 39.3
7 University 38.7
8 Glenfield-Jane Heights 38.2
9 Cliffcrest 37.5
10 Scarborough Village 37.4
Drug charges
Rank Name Drug charges per 10,000 residents
1
Moss Park 185.3
2 Kensington-Chinatown 106.5
3 University 69.7
4 South Parkdale 65.9
5 Beechborough-Greenbrook 58.6
6 Bay Street Corridor 55.7
7 Regent Park 55
8 Roncesvalles 49.2
9 Pelmo Park-Humberlea 49.2
10 Weston 49
Stolen vehicles
Rank Name Vehicle thefts per 10,000 residents
1
Yorkdale-Glen Park 93.2
2 West Humber-Clairville 84.5
3 Islington-City Centre West 49.4
4 Humber Summit 47
5 York University Heights 44
6 Downsview-Roding-CFB 36.9
7 Pelmo Park-Humberlea 33.2
8 Brookhaven-Amesbury 29.3
9 Clanton Park 28.7
10 Humbermede 28.4
Thefts over $5,000
Rank Name Thefts over $5,000 per 10,000 residents
1
Elms-Old Rexdale 23.1
2 West Humber-Clairville 15.8
3 Bay Street Corridor 15
4 Flemingdon Park 13.5
5 Yorkdale-Glen Park 9.5
6 North St. James Town 9
7 Dufferin Grove 8.7
8 Banbury-Don Mills 8.6
9 Princess-Rosethorn 8.1
10 Bedford Park-Nortown 7.7
Murders
Rank Name Murders per 10,000 residents
1
Lambton Baby Point 2.5
2 Beechborough-Greenbrook 1.5
3 Victoria Village 1.2
4 Danforth Village-Toronto 1.1
5 Rustic 1
6 Regent Park 1
7 Rexdale-Kipling 1
8 Etobicoke West Mall 0.9
9 Downsview-Roding-CFB 0.9
10 Woodbine Corridor 0.9
http://www.cbc.ca/news/canada/toronto/story/2012/10/23/toronto-top-10-crime-neighbourhoods126.html

