

美国中文网张衡君编译/美国反对种族隔离的运动结束数十年后,第一位黑人当选美国总统的三年后,美国仍然是一个明显的种族分化的国家。
最新的人口普查局公布的数据,证实这是一个事实,美国的白人和黑人仍倾向于生活在自己的社区,经常彼此隔离甚远。每十年一次的人口普查报告显示,种族隔离只是缓慢地下降,分界线正转变为中等收入的黑人,拉美裔和亚裔人口迁移往白人的郊区,于是当有其他族裔迁入,白人往往会搬走。
美国历史上,最严重的种族隔邻问题,是发生在南部的地区,当年的餐厅内,黑人分区进食,巴士抵制黑人和三K党的恐怖主义。但是,新的普查数字提醒人们,美国北部的城市,早已比南方地区种族分离率更高。
以下是全国最严重种族隔离的大都市地区,主要针对超过 500,000人口的城市。这项是基于相异指数,即社会科学家用于衡量居住隔离的指数。它反映了一个种族的人口,在这一项调查下,只针对白人或黑人,指数是 1的,代表完美的融合现象,相反指数是100 ,代表完全隔离。排名由密歇根大学的社会科学数据分析网络和人口调查网的约翰保罗德威特(John Paul DeWitt)编制的。
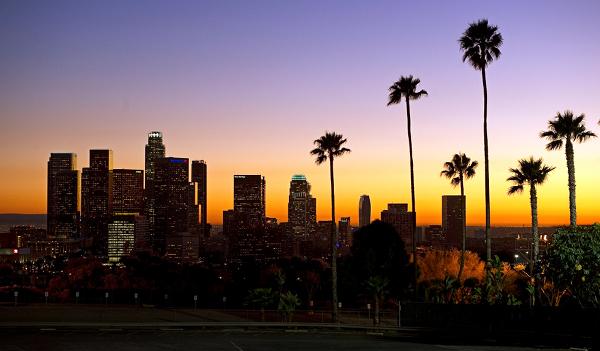
第十位 洛杉矶(Los Angeles)
主要城市的人口:3,792,62
大都市人口: 12,828,837
隔离指数: 67.84
洛杉矶是明显多元化的城市,但也是严重种族隔离的地方。虽然黑人和拉丁裔的人口越来越住在邻近,但是他们和白人社区仍然存在分离,事实上,洛杉矶是一个少数的大都会,出现与拉美裔人口隔离高指数的地区。这也是出现在排行榜上,唯一一个美国西部大湖地区的城市。
社会学家卡米尔查尔斯(Camille Z. Charles)说:“有趣的是,一些历史上较低隔离的地方,往往是规模较小,只有较少的黑人人口,或中等规模的大都会地区。所以,我认为在一定程度上,这是洛杉矶出现种族隔离的原因,在凤凰城自1990年以来,才开始有黑人迁入,相反,洛杉矶超过 100年前,已经有大量的黑人存在。”
像其他北部和西部的城市,黑人移居到洛杉矶,主要是寻找工作。在洛杉矶港口,船坞及军工业等行业的蓬勃发展,提供许多的就业机会,以前这些职位均保留给白人。 但是,第二次世界大战后,大批的黑人迁入洛杉矶,种族隔离的黑人继续被限制在该地区最危险的街道,那一区也是学校最差的区域。
查尔斯指出:“我们可能永远不会达到一个的地步,种族隔离指数是零,美国人融洽相处和通婚,主要隔离的问题也是贫困人口集中在一起,生活质素也相对低,明显的是,如果一个社区集中贫穷人口,将会出现更多的犯罪,健康问题和学生成绩差的学校。”查尔斯说,如果黑人隔离与亚裔隔离的问题相比,将有改善黑人生活质量的巨大机会。因为在美国,亚裔的隔离指数低于20,大部份是新移民聚居的短暂隔离的情况。
在60年代后期,在许多城市出现暴乱,导致白人社会分隔贫困的黑人聚居区。凯尔Kerner 委员会指出:“我们的国家正在走向两个社会,一个黑人,一个白人,隔离和不平等。”1992年的洛杉矶暴动,如1965年瓦特暴乱,引起了警方的反暴行动。近20年后,失业贫民区的黑人和拉美裔依然在洛杉矶存在,然而因为地区大,很难说清楚它的边界在那里。

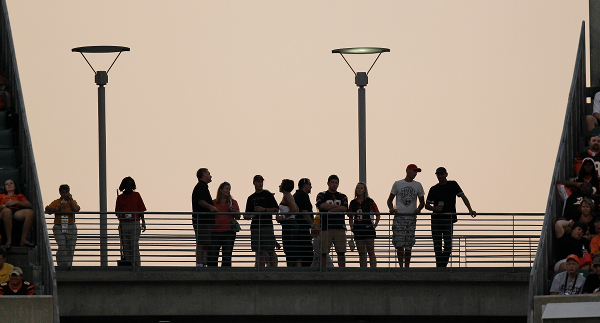
第九位 费城(Philadelphia)
主要城市的人口: 1,526,006
大都市人口: 5,965,343
隔离指数: 68.41
据宾夕法尼亚大学历史学家托马斯 (Thomas Sugrue)指出,在1946年至1953年间,费城地区建成的12万个住宅房屋,只有347个开放予黑人。在战后的岁月里,工人阶级的白人激烈地对所在的社区划出界限,1990年代,中产和上层阶级的白人早已逃往郊区。今天,在费城北部和肯辛顿,工人阶级的白人和黑人社区之间,由波多黎各族裔分隔开。
托马斯说:“这些住房隔离的模式,是昔日歧视性的公共政策和房地产的做法所遗留下来的,造成今日费城地区的面貌,虽然现在歧视是非法的,这些模式的分离却是如此根深蒂固,许多人也视为正常的现象。”
根据人口普查数据,1990年代,在费城地区的黑人和白人分隔区,有慢慢下降的趋势。当第二次世界大战后,黑人家庭迁入,白人居民纷纷逃往郊区,当黑人和拉丁裔移往郊区时,白人再搬往远郊地方。
当地媒体报导,2010年人口普查数据强调,费城为 50年来首次人口上升,主要因为不断增长的拉美裔和亚裔人口。但是,持久性的隔离问题,并未有提到。明确的是,白人主导的增长出现在宾夕法尼亚州遥远的切斯特(Chester)县,新泽西州的格洛斯特(Gloucester)和海洋(Ocean),马里兰州的塞西尔(Cecil)。然而,最明显的是所有黑人,拉美裔和亚裔搬到的郊区,白人人口就会减少。
在1950年至1960年代期间,费城是一个积极推动社会改革的中心点,民权活动家和房屋开发商莫里斯米尔格拉姆(Morris Milgram)在领导全国性的运动时,建立他自己的综合社区。第一个发展的是协和公园,在当时只有白人居住的地区莱维敦(Levittown)成立。
取消种族隔离在南新泽西州的特拉华河,曾一度成为极大的争议,在那里的郊区甚为分散,富人和白人的社区,跟穷人的仓库,各不相连的。在费城,有关于种族问题的讨论通常会出现震耳欲聋的反弹,当地的白人居民史蒂夫阿洛(Steve Arlo)最近回应:“我和妻子有三份的工作,我们尽量住在距离黑人的社区,我不想他们住在附近,我不想让任何接受任何类型政府援助生活的人,靠近我们。我一年交付数千元的联邦,州,市和物业税,我会这么说,他们不值得住在我家附近。我们何时可停止这个免费拿政府补助的心态呢?我不管他们居住的环境有多恶劣。记住,生活质素良好的社区是由邻近的居民组成。”对于当地的白人来说,美国梦意味著可自由地从社会上把穷人和黑人分隔出来。
第八位 辛辛那提(Cincinnati)
主要城市的人口: 296,943
大都市人口: 2,130,151
隔离指数: 69.42
在大迁徙的开始之时,大量住房的拥有者都是白人,辛辛那提的黑人分隔住在白人社区的外围。在1930年代,第一个黑人聚居区,出现在城市的西区,当时白人开始迁出。莱茵(Rhine)一个历史悠久,由19世纪德国移民建造的社区,后来成为该城市标志性的黑人聚居区。
水牛城大学的历史学教授亨利路易斯泰勒(Henry Louis Taylor)说:“在30年代和40年代,作为迁移时代的开始,白人开始离开城市中心,搬入山顶的社区,在 1950年代,60年代和70年代,当白人离开辛辛那提,种族隔离居住的现象加剧。”
自1980年以来,黑人佔全市人口已从百分之34增加至百分之46。辛辛那提大学历史学家大卫斯特拉德林(David Stradling)表示:“白人试图逃离一个城市,潜在许多方面的原因,最明显的是种族主义,有些白人家庭决定要么抵御黑人家庭的到来,或简单地逃离,放弃防守。这两项的战略均不利于取消种族隔离的问题。”
据斯特拉德林指出,相对规模较小,在辛辛那提比周围的郊区,使人们更容易维护全白人的社区。然而,随著越来越多的黑人迁往郊区,许多白人的反应是搬往更远的地区。泰勒说:“这是关于房屋价值,许多白人仍然认为,黑人搬入之后,对街道和社区将产生负面影响,房屋价值随即下跌。”
因此,黑人仍然集中在城市的中心,与白人社区分隔。斯特拉德林说:“在30年代中期,联邦资金用于拆除中央西区的黑人贫民区和兴建公共房屋,企图改变城市中心的面貌,最大的打击来自于1950年代末,当中央西区被完全摧毁,街道重新改变,重建地点预计引入低层工业区,政府逼令数千名黑人搬离市中心,可悲的是,城市的中心重建计划,根本吸引不到白人重新搬入,造成数千人流离失所。”
2001年,黑人贫民区莱茵爆发一宗严重的骚乱,起缘于警察杀害一名手无寸铁的黑人少年。新上任的共和党州长约翰(John Kasich)没有考虑种族分离的城市问题,斯特拉德林说:“他的兴趣是扩大公路的开支,而不是花费在市区的核心。”
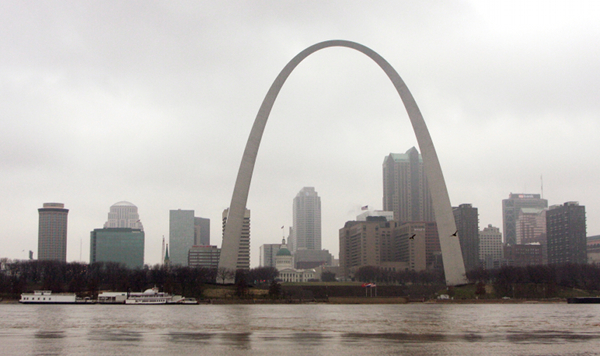
第七位 圣路易斯(St. Louis)
主要城市的人口: 319,294
大都市人口: 2,812,896
隔离指数: 72.3
爱荷华大学历史学教授科林戈登(Colin Gordon)指出,直至 1960年代,全县的界线严格划分了圣路易斯,黑人在城市,白人在外围。他说:“两者之间的边界,如同德国的柏林围墙,基本上以财富和种族来划分的。”
实际上,有一些指定的黑人聚居区被拆除,居民被迫搬入城市的公共住房。现时,许多人也离开圣路易斯。戈登说:“我们传统认为白人会搬离,现时黑人也决定迁出圣路易斯,这座城市几乎是清空的,在县邻近的地方,也是黑人主要的聚居区。”
东圣路易斯是更加沮丧的,在1917年7月,在美国历史上,发生最严重的种族暴乱,一群暴徒袭击,造成39名黑人死亡,烧毁了整个黑人社区。在20世纪下期,黑人和白人停止进攻,只是搬到远离地方。现时,城市几乎百分之97的人口是黑人。然而,大城市很快忘记过去的历史,戈登说:“当你开车到圣路易斯,最明显可见的是一些百无禁忌的脱衣舞俱乐部的广告。”
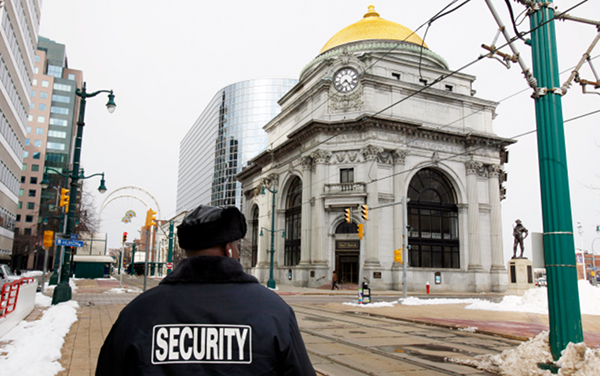
第六位 水牛城(Buffalo)
主要城市的人口:261,310
大都市人口:1,135,509
隔离指数:73.24
直至1940年代,大批的黑人还未移居到水牛城,比较底特律和费城的城市更晚,在钢铁和汽车行业蓬勃发展的时期,吸引大批的黑人涌入,早期的黑人和白人共同生活在繁华的社区,其后新移居的黑人却被逼进入贫民窟。
水牛城大学的历史学教授亨利路易斯泰勒说:“水牛城的主要黑人区,也算是一个多种族的社会,因他们会与波兰,意大利和俄罗斯的新移民,甚至是少数的爱尔兰人,居住在同一个社区。不仅如此,他们实际上住在同一个公寓楼。”
然而,新政策却推动黑人和白人的隔离,从此,黑人被视为威胁到房屋的价值,白人纷纷离开,当地的工业正在迅速消失。泰勒说:“接连其他州省的公路兴建,促使白人搬离城市中心。即使在城市拥有房屋的白人也开始划分区域,白人区域的房价上升,令贫穷的黑人或其他族裔无法负担得起房子,造成严重的分化。”
水牛城大学城市研究的教授罗伯特西尔弗曼(Robert Silverman)说,房地产经纪人都迫不及待地想在热潮中赚钱,地产代理商进入一个白人社区,告诉业主许多少数族裔人士不断搬入,鼓励他们卖掉房子,然后再高价转卖予黑人,数年下来,该区成为黑人聚居地,房价却大幅下降,因银行贷款不会批予一个黑人为主的社区。
西尔弗曼发现,穷人的权利一直被剥夺,因为水牛城有限的公共交通,官员缺乏沟通和歧视问题,无法在水牛城的郊区负担得起住房。他说:“在过去的50年,虽然在大都会区的人口一直停滞,郊区人口实际上已经增加,只是非裔美国人没有加入这些房地产市场。”或许最令人不安的是,在郊区发现最多黑人人口的地方,达百分之3.7以上,竟然是在该区的监狱里。
事实上,郊区正在经历似乎是一个稳定的整合社区,西尔弗曼说:“白人并没有逃离这些地区,中产阶级和工人阶级的黑人正搬入这些地区,企图为孩子寻找更好的教育机会和生活质素。这是跟以往有明显的分别的,不过,一些留在水牛城市中心贫穷地区的,仍然是处于严重的种族隔离,阶级分化的现象。”
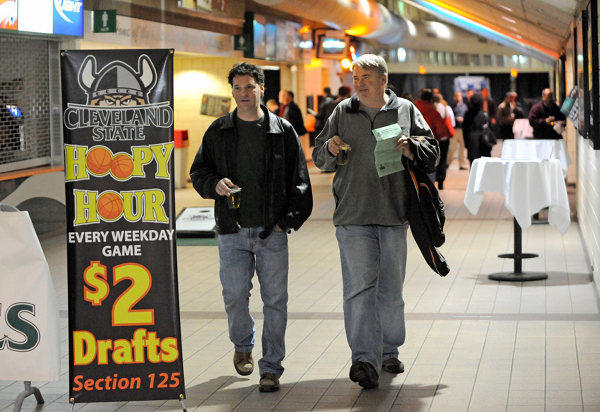
第五位 克利夫兰(Cleveland)
主要城市的人口: 396,815
大都市人口: 2,077,240
隔离指数:74.14
美国历史研究教授金伯利菲利普斯(Kimberley Phillips)说:“非裔美国人,搬到克利夫兰之后,只有极少数的房屋选择,所以,他们只能搬到那些白人留在东城的老房子里。对于其他族裔群体,也有类似的隔离模式出现过,早在20世纪,黑人,犹太人和意大利人都是高度隔离的。一些工人,穷人往往拥有最少的住房选择,持久性的种族隔离,几乎是这里的特色。”
工作阶层的白人,认为最大的资产是他们的家园,他们认为黑人是一个具影响性的危险。他说:“这里有一个笑话,你需要一本护照,走到城市的另一面。”现在,这些资产的价值正在下降,从 2000年开始,克利夫兰发布了百分之十七的人口亏损,跌破40万。现在的城市人口小于内布拉斯加州的奥马哈(Omaha)。
克利夫兰州立大学的城市事务教授马克萨灵(Mark J. Salling)指出,黑人正迁入邻近郊区,白人搬到更远的地区。他说:“我不会形容为白人的大迁移,有许多新房子建在市中心的边缘地区,只是没有人迁移到该地区。”
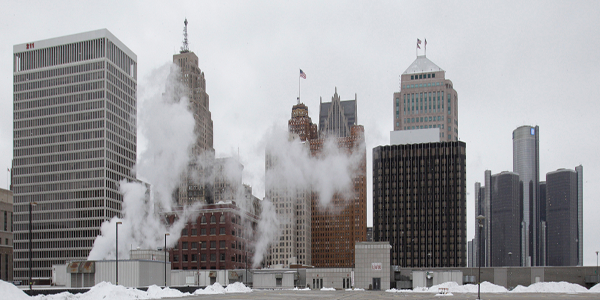
第四位 底特律(Detroit)
主要城市的人口: 713,777
大都市人口: 4,296,250
隔离指数:75.25
新的人口普查数字显示,城市的人口下降25个百分点。
早在20世纪,城市的房地产是有价值的,并由白人小心翼翼地守护著。在汽车及国防工业蓬勃发展的期间,几十万的黑人迁移到城市工作。
在1920年代,1930年代和1940年代,工人阶级的白人购买房子,并开始确定为白人主要区域,意味著把黑人赶走,造成黑人极端的住房短缺,远离白人区和就业机会大的地方。随著限制性公约,禁止出售住房给非白人,歧视性的公共和私人贷款的做法,底特律发生多次广泛的种族暴动,暴力对待黑人和破坏其财产,逼使他们搬出城市,在下东城聚居于贫民窟。
宾夕法尼亚大学历史学教授汤姆(Tom Sugrue)说:“在美国20世纪,底特律是种族隔离最严重的城市,这个城市一方面变成了大批黑人移民涌人的地区,另一方面,又是白人激烈捍卫自己地盘的城市,抗拒黑人新移民涌入。”
有发展商甚至筑起了一道6英尺高的水泥墙,隔离开白人与黑人社区。汤姆说:“在许多居民区,白人用暴力和恐吓阻止黑人新移民。接近250宗暴徒的事件,直接针对和破坏搬入的黑人家庭,白人还形成数以百计的’邻里改善协会’,把黑人列为’不受欢迎的人’ 。 房地产经纪人和抵押贷款机构,也发挥了关键作用,创造了一个反黑人的不自由的房屋市场。”
底特律各行业下降的趋势,黑人被困在一个日益扩大的失业和贫民窟。1980年,黑人失业率上升至百分之22.5。白人的产业移向郊区,1972年,大多数白人支持民主党总统候选人阿拉巴马州州长乔治华莱士(George Wallace),曾宣称:“现在隔离,明天也隔离,永远的种族分离。”获得许多白人的共鸣。
新的人口普查数字显示,大量的黑人迁往郊区,有趣的是,底特律自2000年以来,种族相异的指数下跌10点,这可能是一个好消息,也有可能是因为底特律的经济灾难,造成许多黑人正逃离该城市。汤姆指出,事实上,许多白人被困在倒塌的房屋市场,无法移动,因此种族隔离率下降。在底特律市,拉美裔是唯一增长的人口。
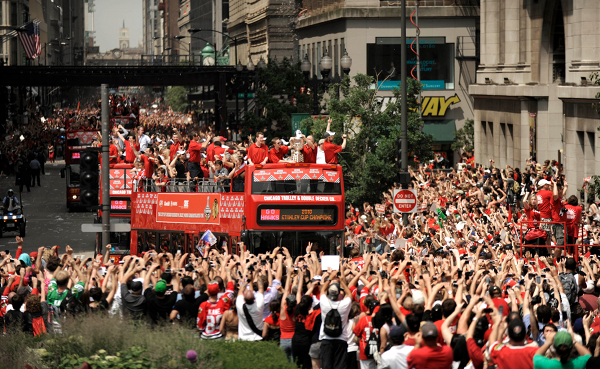
第三位 芝加哥(Chicago)
主要城市的人口: 2,695,598
大都市人口: 9,461,105
隔离指数: 76.43
在芝加哥,白人示威者举行反对开放住宅区的游行,有人曾用砖头击中马丁路德金的头部。他后来说,从来没有见过这么多人对种族有仇恨和敌意。
美国西北大学社会学研究的教授林肯奎安(Lincoln Quillian)指出,大约在 1915年前,开始有大批黑人迁移到芝加哥,自此,种族隔离的现象明显。“在第二次世界大战以后,随著黑人从南方大迁徙往北方的工厂,情况更加严重。当时在芝加哥只有南面一些地方,开放给黑人的。”
像其他所有的移民一样,黑人往往居住靠近亲戚和朋友之间的地区。但是,一旦安定下来,他们移动到邻近的白人社区,创造出芝加哥历史学家阿诺德赫希(Arnold Hirsch)所谓的“第二贫民区。”后来,一些工业的搬迁,工人阶级的黑人也跟随转到城市南部和西部的贫民区,成为哈佛大学社会学家威廉朱利叶斯威尔逊(William Julius Wilson)所说的“失业贫民区。”
威尔逊说:“导致种族隔离的主要原因,是白人有组织地反对黑人的扩大,包括有步骤地消除他们在住宅区和就业机会的竞争力。自1980年以来,超过三分之二的就业增长,出现在城市中心的外围地区。”
芝加哥的标志性公共房屋,现在经已拆除,代表著昔日贫困黑人的集中地。种族隔离的公共房屋,事实上,是白人积极保持自己社区的成果。同时,威尔逊说:“州际公路的选址,也是隔离黑人社区的政策,14号瑞安丹高速公路,正是创造了黑人和白人之间的屏障。”
然而,随著拉美裔人口增加百分之25,芝加哥城市是越来越多元化,有一些融合的社区出现,包括罗杰斯公园的北部,那里有混合白人,黑人,亚洲人和拉丁美洲人生活的社区。
奎安说:“这可能有帮助,因为没有一个单一的族裔完全管理该社区。”然而,在芝加哥的郊区也曾经出现反对融合社区的生活。在西塞罗(Cicero)位于城市西边的郊区,于 1951年成千上万的白人袭击一个搬进了公寓大楼的黑人家庭。一位活动家指出,当在密西西比,白人焚烧黑人教堂时,在芝加哥,他们烧毁黑人家园。今天,在西塞罗的主要人口是拉丁裔,佔百分之87。
橡树园区住房中心行政主任罗布(Rob Breymaier)协助促进西塞罗南部综合住房计划,他说:“1960年代,人们恐慌发生于芝加哥市西面的种族暴力冲突事件,他们会告诉房地产经纪人,在住房价格下跌前,想卖掉房子搬离开黑人社区。”橡树园住房区,是一个极少数可融合黑人和白人一起的地区,在芝加哥地区,这绝对是一个例外。如今,许多中等收入的黑人也搬往芝加哥的郊区,许多社区也开始出现有种族融合的现象,但是白人的社会仍然是很抗拒的。
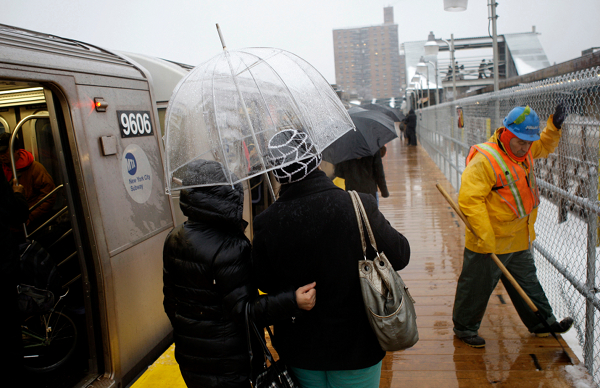
第二位 纽约(New York)
主要城市的人口: 8,175,133
大都市人口: 18,897,109
隔离指数:78.04
纽约是美国第二个种族最严重的城市。取消种族隔离是很难克服的。1940年,大都会(MetLife)拒绝黑人租住曼哈顿的史岱文森镇的公寓。1980年,洋基郡几乎陷入破产,因企图在城市东部的白人社区建设经济适用的房屋而引起的争议。纽约是洛杉磯以外,另一个城市,成为拉美裔最多的聚居社区。
纽约大学城市规划和公共政策教授英格丽古尔德艾伦(Ingrid Gould Ellen)说:“纽约市是最密集的城市,远远超出数据所显示的,纽约市比周边地区,亚特兰大和休斯顿的面积少10倍。因为公共交通系统的完善,平日乘坐交通工具时,往往是一个多元化的经验,每天上下班的纽约客,可有助减少种族隔离的现象,因此统计不能在纽约市具有代表性。”
艾伦说:“纽约与洛杉磯的比较是,我住在纽约办公室邻近,我每天也坐地铁上班,但是,如果我住在洛杉磯,我必须要开车,离开我所住的白人社区,再开车到另一个社区上班,这是非常不同的。”
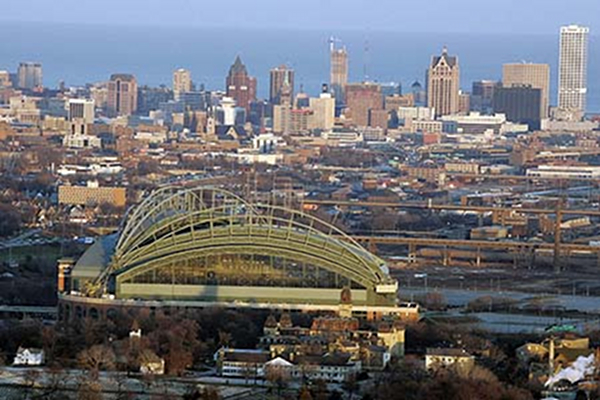
第一位 密尔沃基(Milwaukee)
主要城市的人口: 594,833
大都市人口: 1,555,908
隔离指数:81.52
一直以来,密尔沃基是被评为美国种族隔离最严重的都市地区。跟底特律和其他榜上有名的大多数地方一样,密尔沃基一直饱受非工业化,城市黑人种族隔离,就业机会少的问题。
威斯康星州密尔沃基大学历史和经济发展教授马克列文(Marc Levine)说:“在芝加哥,克利夫兰,甚至巴尔的摩的历史很相似,每个地区都有分区条例,然后由房地产经纪人限制性规定分化不同的种族。这几乎是标准的历史。不过,到底是什么让密尔沃基不同于其他地方,成为榜名第一位?因为这里比较任何的城市,拥有最低的非裔郊区的比率。”
从全国范围来看,黑人都集中在市中心,远离创建的新工作机会地区。密尔沃基更是极端的,百分之九十的黑人生活在城市中心。更糟的是,郊区的白人明显的敌视于任何连接城市的人到郊区工作的交通建设,进一步加剧分化。
威斯康星州州长史葛沃特(Scott Walker)率先在整治公共交通连接郊区和城市时,提出反对的意见,他认为这些资金应该运用在高速公路上。马克列文曾经做了一些研究,发现全国30个最大的都会区,密尔沃基在城市和郊区之间的差距是最大的。密尔沃基大学公佈的一项研究,认为这种的差距是基于“种族偏见”。
当全美国各地的人们谈讨种族问题时,密尔沃基的白人却很少讨论的,这扭曲的思维方法,是令人惊讶的。马克列文指出,“在密尔沃基地区,这不是真的有争议的。因为没有人认真地怀疑过自己生活在高度隔离的地方。”
http://www.sinovision.net/
The 10 most segregated urban areas in America
Slide show: The new census numbers provide a sobering reminder of how separate white and black America still are
By Daniel Denvir
Note: Based on the reader response to this article, Denvir penned a follow-up, “Five myths about the 10 most segregated metro areas.” You can find that piece here.
Decades after the end of Jim Crow, and three years after the election of America’s first black president, the United States remains a profoundly segregated country.
That reality has been reinforced by the release of Census Bureau data last week that shows black and white Americans still tend to live in their own neighborhoods, often far apart from each other. Segregation itself, the decennial census report indicates, is only decreasing slowly, although the dividing lines are shifting as middle-income blacks, Latinos and Asians move to once all-white suburbs — whereupon whites often move away, turning older suburbs into new, if less distressed, ghettos.
We may think of segregation as a matter of ancient Southern history: lunch counter sit-ins, bus boycotts and Ku Klux Klan terrorism. But as the census numbers remind us, Northern cities have long had higher rates of segregation than in the South, where strict Jim Crow laws kept blacks closer to whites, but separate from them. Where you live has a big impact on the education you receive, the safety on your streets, and the social networks you can leverage.
The following is a list of the nation’s most segregated metropolitan areas of over 500,000 people. The rankings are based on a dissimilarity index, a measure used by social scientists to gauge residential segregation. It reflects the number of people from one race — in this case black or white — who would have to move for races to be evenly distributed across a certain area. A score of 1 indicates perfect integration while 100 signals complete segregation. The rankings were compiled by John Paul DeWitt of CensusScope.org and the University of Michigan’s Social Science Data Analysis Network.
View the slide show
Daniel Denvir is a journalist in Philadelphia. More: Daniel Denvir
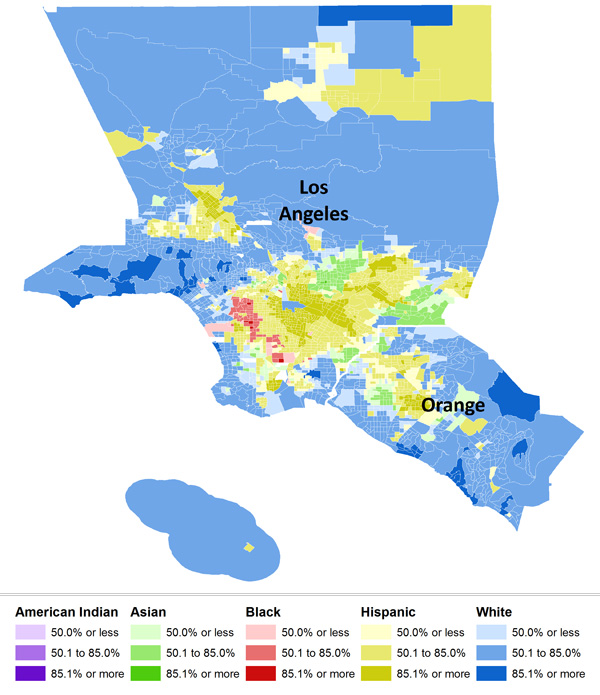
No. 10: Los Angeles
Main city population: 3,792,62
Metropolitan population: 12,828,837
Segregation level (dissimilarity): 67.84
Los Angeles is spectacularly diverse, and profoundly segregated. Though black and Latino Angelenos are increasingly likely to live near one another, their separation from white neighborhoods persists. Indeed, L.A. is one of just a few metro areas with such high segregation of Latinos. It is also the only metro area on this list west of the Great Lakes.
“The interesting thing is that the places where we’ve seen lower segregation historically tend to be smaller and medium-size metro areas, with smaller black populations,” says sociologist Camille Z. Charles, author of “Won’t You Be My Neighbor: Race, Class and Residence in Los Angeles.” “So I think to some degree that is how L.A. ends up being this outlier. There have only been black people in Phoenix since 1990 in any meaningful number. You’ve had large numbers of blacks in Los Angeles for over 100 years.”
Like other cities in the North and West, blacks migrated to Los Angeles for jobs. At the Port of Los Angeles, shipyards and the booming war industry provided opportunities for employment in positions that were previously reserved for white men. But the enclaves that blacks moved into after World War II have hardened, and segregation continues to confine blacks to the region’s most dangerous neighborhoods (which also contain its worst schools).
“We will probably never get to the point where the index is zero and everyone is singing kumbaya and intermarrying,” says Charles. “What is problematic about segregation is primarily about the concentration of poverty, and all of the negative aspects of material life that result from concentrating poverty in that way. If you concentrate poverty, you’re going to have more crime, more people with poor health — areas where the rest of the community and city is less invested in not only the people, but the streets and the schools.”
Charles says that if black segregation were comparable to that of Asians, there would be “huge improvements in blacks’ quality of life.” Asian-white segregation is about 20 points lower, and much of it reflects the temporary segregation of immigrants living in ethnic enclaves.
In the late 1960s, riots — or, depending on how you parsed this politicized vocabulary, rebellions or uprisings — in many cities briefly forced white society to face the concentrated poverty of the black ghetto, with the Kerner Commission famously noting that “Our nation is moving toward two societies, one black, one white — separate and unequal.”
The L.A. riots of 1992, like the 1965 Watts riot, were sparked by police brutality, a steady concern in besieged neighborhoods like South Central. Nearly 20 years later, the jobless ghettos of black and Latino Los Angeles remain. Greater Los Angeles has been so big for so long — legion nodes connected by extensive highways — that it’s hard to say exactly what its borders are. Safe in their cars and behind their gates, most white people have gone back to not paying attention.
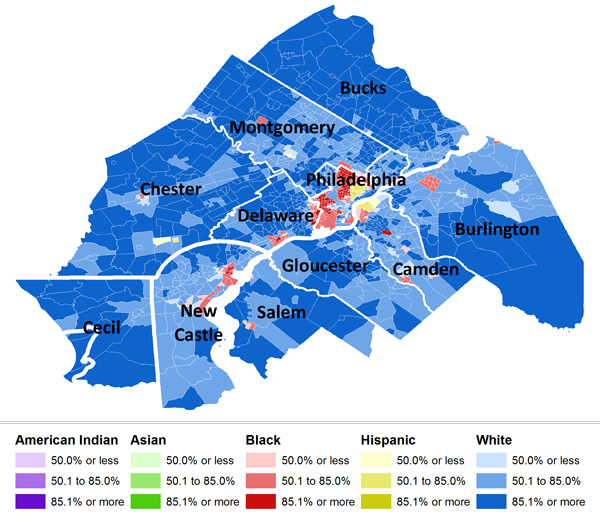
No. 9: Philadelphia
Main city population: 1,526,006
Metropolitan population: 5,965,343
Segregation level (dissimilarity): 68.41
According to University of Pennsylvania historian Thomas Sugrue, just 347 of the 120,000 homes constructed in the Philadelphia area between 1946 and 1953 were open to blacks. In the postwar years, working-class whites violently policed the boundaries of their neighborhoods, while the middle and upper classes fled to the suburbs well into the 1990s. Today, Puerto Rican neighborhoods divide working-class white and black neighborhoods in North Philadelphia and Kensington.
“The patterns of housing segregation in metropolitan Philadelphia are the legacy of discriminatory public policies and real-estate practices that played out for most of the 20th century,” says Sugrue, who chronicled the area’s open housing movement in “Sweet Land of Liberty: The Forgotten Struggle for Civil Rights in the North.” “Though discrimination is now illegal, those patterns of segregation were so deeply entrenched that many people came to see them as ‘natural.'”
According to census data, the level of segregation between blacks and whites in the Philadelphia area is declining at a slower rate than during the 1990s. And just as white city-dwellers fled neighborhoods when black families arrived after World War II, suburban whites are fleeing to exurbs as blacks and Latinos move to older suburbs.
Local media coverage of the 2010 census data has emphasized that Philadelphia grew for the first time after 50 years of decline, thanks laregly to growing Latino and Asian populations. The persistence of segregation, however, has gone unmentioned, but the warning signs are clear: Whites led growth in far-flung counties like Chester in Pennsylvania, Gloucester and Ocean in New Jersey, and Cecil in Maryland; white population declined everywhere else as blacks, Latinos and Asians moved to resegregating older suburbs.
During the 1950s and ’60s, Philadelphia was a center of open housing activism. Civil rights activist and housing developer Morris Milgram, the Jewish son of left-wing garment-worker activists, was at the lead of the nationwide movement, building his own integrated neighborhoods in the 1950s and ’60s. The first development was Concord Park, built as a near replica of the then-whites-only subdivisions in Levittown.
Desegregation has also been contentious across the Delaware River in South Jersey, where suburbs are deeply fragmented, with miniature tax fiefdoms for the rich and white just minutes from crumbling warehouses for the poor like Camden.
Discussions about race in Philly are usually met with a deafening backlash from local whites, and the comments sections of the website of the Philadelphia Inquirer and Daily News are locally infamous for their bigotry. Witness the letter to the editor written in response to this reporter’s recent article on regional segregation for Philadelphia Weekly:
“Between my wife and I, we work 3 jobs in one household so we can live as far as possible from Section 8 housing. Keep your brave new world, liberal views to yourself. I don’t want section 8 anywhere near me. I don’t want anyone receiving any type of government assistance living near me,” wrote Steve Arlo. “I pay THOUSANDS of dollars a year in Federal, State, City and property taxes to keep it away from my neighborhood. I’ll say it. They don’t deserve to live in or near my neighborhood. When are we going to stop this ‘free money’ mentality? I don’t care how horrible their neighborhood is. You made your bed now sleep in it. Remember, neighborhoods are made up of those that live in them.”
For the besieged white subdivision dweller, the American dream means freedom from society’s poor and black.
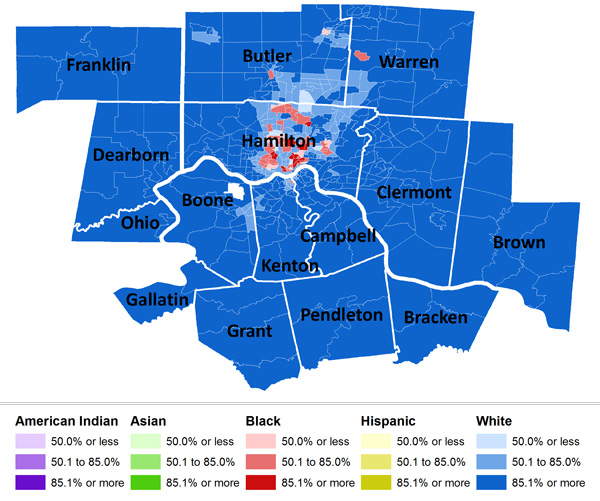
No. 8: Cincinnati
Main city population: 296,943
Metropolitan population: 2,130,151
Segregation level (dissimilarity): 69.42
Before the Great Migration and the rise of exclusively white mass homeownership, Cincinnati blacks lived alongside white ethnics. The first black ghetto emerged in the city’s West End during the 1930s as whites began to move out, spreading as white flight picked up. Over-the-Rhine, a historic 19th-century neighborhood built by German immigrants, later became one of the city’s iconic black ghettos.
“In the ’30s and ’40s, as migration starts, [white] people start to move out of the basin,” says Henry Louis Taylor Jr., a history professor at the University at Buffalo and the author of “Race and the City: Work, Community, and Protest in Cincinnati, 1820-1970.” “As they move out of the basin into these hilltop neighborhoods, you get the first legitimate wave of segregating communities … In the 1950s, ’60 and ’70s, as they leave Cincinnati, the patterns of racial residential segregation intensify.”
The black share of the city’s population has risen from 34 to 46 percent since 1980, while that number has stayed stable around the metro region.
“There are so many places where whites will try to flee the problems of the city, including the problem of diversity,” says University of Cincinnati historian David Stradling, author of “Cincinnati: From River City to Highway Metropolis.” “Obviously the No. 1 cause of this is, of course, simply racism. There’s racism that works through the white family who makes the decision to either defend against the arrival of black families or simply flee and give up the defense. Either of those strategies doesn’t help as far as desegregation is concerned.”
According to Stradling, the relative smallness of Cincinnati compared to the surrounding suburbs has made it easy for people to defend all-white communities. And as an increasing number of blacks move to some older suburbs, whites respond by moving farther out.
“It’s about housing values,” Taylor says. “It’s about the fact that whites still believe that the influx of African-Americans into a neighborhood and community will negatively impact on housing values.”
So blacks remain concentrated in the center city, excluded from white neighborhoods and increasingly displaced by large-scale urban renewal projects.
“In the mid-1930s, the city used federal dollars to demolish a big chunk of the central West End and build public housing,” Stradling says. “The biggest blow came in the late 1950s when the lower West End (an area called Kenyon Barr) was completely demolished, the street grid changed, making room for I-75, new, wide streets, and redevelopment sites for low-rise industry (which didn’t really come). Thousands of people (almost all of them African-American) were displaced. And — this is part of the tragedy for the city — those displaced residents were replaced by no one.”
Which brings us back to Over-the-Rhine, where many displaced blacks moved in the 1960s. In 2001, the neighborhood was the epicenter of major riots that exploded after the police killing of an unarmed black teenager. The neighborhood is now gentrifying. Meanwhile, the region’s segregation remains intact and the matter is not considered a priority for newly inaugurated Republican Gov. John Kasich.
“Right now, we’ve got a pretty reactionary governor,” says Stradling. “And he’s not interested in the urban core. There are a lot of places growing in Ohio, but the problem is how they grow at the expense of other parts of Ohio. I see years of expanded highway spending, and not spending in the urban core.”
No. 7: St. Louis
Main city population: 319,294
Metropolitan population: 2,812,896
Segregation level (dissimilarity):72.3
“St. Louis, like Louisville and Baltimore, is Southern in race relations and Northern in its organization of property,” says Colin Gordon, a history professor at the University of Iowa and the author of “Mapping Decline: St. Louis and the Fate of the American City.”
Until the 1960s, the county line strictly divided St. Louis: blacks on the city side, and whites on the county side. “The boundary between the two was a sort of Berlin Wall based on both wealth and race. The suburbs that developed on the western edge of the city, the Missouri suburbs, assiduously used private deed restrictions, FHA guidelines and exclusionary zoning to try to maintain that split.”
The few black settlements in the county that predated the suburbs were actually torn down, the residents forced into public housing in the city. But these days, everyone is leaving St. Louis.
“What we conventionally think of as white flight is now black flight as well,” says Gordon. “The city itself is just emptying out and the predominant area of African-American settlement is in St. Louis County.”
Not that this is leading to newly integrated suburban neighborhoods. “It tends to be 90 percent one or 90 percent the other,” he says. “The metro area is just thinning out.”
East St. Louis is St. Louis’ even more depressed sister city across the river in Illinois. In July 1917, it was the site of one of the worst race riots in American history, a mob attack on blacks that historians now call a massacre: 39 blacks were killed and entire black neighborhoods burned down. During the second half of the 20th century, whites stopped attacking blacks and simply moved far away from them. The city is now 97 percent black.
Hard-luck big cities quickly forget about their even more hardscrabble neighbors. “When you drive into St. Louis the only evidence of East St. Louis are the signs advertising no-holds-barred strip clubs,” says Gordon.
No. 6: Buffalo
Main city population: 261,310
Metropolitan population: 1,135,509
Segregation level (dissimilarity): 73.24
Large numbers of black migrants did not arrive in Buffalo until the 1940s, later than cities like Detroit or Philadelphia. They came for jobs in the booming steel and auto industries, economic engines that spawned machine shops and a sprawling transportation industry. While the city’s early black community lived alongside white ethnics in bustling and crowded immigrant neighborhoods, new migrants found themselves walled into the ghetto.
“The main African-American neighborhood in the city of Buffalo was a multi-racial community in which African-Americans shared residential space with various white ethnics including Polish, Italian and Russians, and to a lesser extent Irish,” says Henry Louis Taylor Jr., a history professor at the University at Buffalo and the author of “African Americans and the Rise of Buffalo’s Post Industrial City.” “Blacks and whites not only shared residential space but actually lived together in the same apartment buildings.”
The New Deal pushed mass homeownership for whites and shut blacks out. From then on, blacks would be seen as a threat to home values. The deinvestment that resulted from rapid white flight made decline a self-fulfilling prophecy. Meanwhile, the industrial jobs that blacks migrated to work in were rapidly disappearing.
“As that population increases, you are right in the heart of the accelerated transformation of the population from center city to suburban. Highways are coming in and they’re trying to get out. Blacks are moving in and they [whites] are ready to sail,” says Taylor. “Homeownership begins to attach a new type of value to the neighborhood. It turns the neighborhood into a commodity, and a separation of the races based on the type of houses you can afford.”
Real estate agents were eager to make money off the boom in homeownership, says Robert Silverman, a professor of urban studies at the University at Buffalo, hoping to profit from the pent-up black demand for housing and growing white fear.
“Blockbusting was taking place, where real estate agents would go into a neighborhood with all white homeowners and basically tell people that minorities are moving in, to encourage them to sell, and then flip the houses at inflated prices to African-Americans. Then lenders wouldn’t lend to areas with an African-American population.”
Silverman and fellow researcher Kelly Patterson found that poor people continue to be denied the right to affordable housing in Buffalo suburbs thanks to limited public transportation, poor communication from housing officials, and outright discrimination.
“Although population in the metro area has maintained pretty stagnant over the past 50 years, the population of the suburbs has actually increased,” he says. “African-Americans just didn’t have access to those housing markets.”
Perhaps most disturbingly, they found that the only two outer-ring suburbs with black populations of above 3.7 percent were home to large prisons.
When affordable housing does get built outside the city, it is overwhelmingly concentrated in the older suburbs. The good news is that some of these inner-ring suburbs are experiencing what appears to be a degree of stable integration.
“Whites aren’t fleeing those areas,” says Silverman. “Predominantly middle-class and working-class African-Americans are moving to those areas seeking better educational opportunities for kids and getting access to those jobs that are in those inner-ring suburbs. So as long as the neighborhoods remain stable in terms of their infrastructure and quality of life, you don’t really see people moving out as rapidly. And that’s something that really distinguishes what’s happening now from the past.”
But those blacks who remain in Buffalo’s neighborhoods of concentrated poverty remain segregated by race, and increasingly by class.
No. 5: Cleveland
Main city population: 396,815
Metropolitan population: 2,077,240
Segregation level (dissimilarity): 74.14
“African-Americans that I interviewed had very few housing choices when they came into Cleveland,” says Kimberley Phillips, professor of history and American studies at William and Mary. “So they moved to where they could live, which were older houses that white ethnics left on the East Side.”
Phillips is the author of “Alabama North: African American Migrants, Community, and Working-Class Activism in Cleveland.”
“For other groups, there were similar patterns of segregation in particular moments in time. In the early 20th century, blacks, Jews and Italians were all highly segregated. These were working people, poor people, the groups that tended to have the fewest housing choices,” says Phillips. “The persistence of black residential segregation is remarkable.”
White working-class people’s greatest asset was their home. They perceived blacks to be a danger to that wealth and stability — their small and tenuous purchase on the American dream.
“The only leverage the white working class had was in their homes. That fear drove them to organize in ways that otherwise they might not have,” she says. “There was always a joke that you needed a passport to go from one side of the city to the other.”
Now the value of those assets is falling across the board. Cleveland posted a 17 percent population loss since 2000, falling below 400,000. Once a manufacturing behemoth, the city is now smaller than Omaha, Neb.
Blacks are moving into nearby neighborhoods and suburbs, while whites are moving farther away, says Mark J. Salling, a professor of urban affairs at Cleveland State University and an expert on the area’s demography.
Salling, unlike others interviewed for this series, doesn’t see the process in racial terms. He says that a simple equation is at work: Continuing suburban sprawl without population growth is hollowing out the city center. New construction continues to spread outward long after the region’s population stagnated.
“I wouldn’t describe it as white flight,” he says. “I don’t think many people are moving out because African-Americans are moving into the neighborhoods. We continue to have new houses built on the fringes of the area, and no in-migration into the area.”
Phillips, however, says that race continues to fuel the high levels of suburban segregation.
“Some of those segregation patterns migrated to the suburbs,” she says. “It’s a subtle resistance that happens — with very profound effects.”
There are exceptions to the segregated status quo. Like Chicago, Cleveland is home to a suburb that pioneered integrated housing during the 1950s and ’60s.
“Our very first home we bought was in Shaker Heights,” says Phillips, referring to the east-side streetcar suburb. “It was one of those planned communities that got built in 1920s, and they planned integration in 1950s. They established incentives to encourage people to move into certain parts of Shaker Heights. And they wanted to integrate schools, and they wanted to do it naturally without having to bus.”
No. 4: Detroit
Main city population: 713,777
Metropolitan population: 4,296,250
Segregation level (dissimilarity): 75.25
The new census numbers show a 25 percent decline in the city’s population, a shock to even the most pessimistic local observers. Detroit, measured at 713,777 people in 2010, is in free fall.
In the early 20th century, however, the city’s real estate was valuable, and jealously guarded by whites. The hundreds of thousands of blacks who migrated to work in the city’s booming auto and defense industries found that most jobs and neighborhoods were closed to them.
In the 1920s, ’30s and ’40s, working-class white ethnics bought homes and began to identify as just “white.” And being white meant keeping blacks, suffering from an extreme housing shortage, away from white neighborhoods and jobs. Along with the restrictive covenants that barred the sale of homes to non-whites and discriminatory public and private lending practice, white Detroiters perpetuated widespread harassment, violence and property destruction against blacks who dared move out of the crowded ghetto in the city’s Lower East Side. “For most of the 20th century, Detroit was one of the most segregated cities in the United States,” says Tom Sugrue, a professor of history at the University of Pennsylvania and the author of “The Origins of the Urban Crisis: Race and Inequality in Postwar Detroit.” “The city became a magnet for black migrants — and whites fiercely defended their turf against black newcomers.”
One developer even erected a 6-foot-high cement wall between white and black neighborhoods to make the former actuarially sound.
“In many neighborhoods, whites used violence and intimidation to deter black newcomers. In my book, I document nearly 250 incidents involving mobs, vandalism and violence directed toward the first black families to move into formerly white neighborhoods. Whites also formed hundreds of ‘neighborhood improvement associations’ that pledged to keep ‘undesirables’ — namely blacks — out. Real estate brokers and mortgage lenders — backed by federal housing policy — also played a critical role in creating an unfree housing market for African-Americans.”
With the relocation and decline of industry, blacks were stuck in an increasingly jobless and expanding ghetto. Black unemployment rose to 22.5 percent in 1980, doubling in just 20 years. White workers, writes Sugrue, followed industry to the suburbs. Those too poor to stay behind became “angrier and more defensive.” In 1972, every majority white ward in the city supported George Wallace in the Democratic presidential primary. The Alabama governor — who once declared “segregation now, segregation tomorrow, segregation forever” — had a message that resonated.
The new census numbers show large numbers of blacks moving to the suburbs, and increasing integration as a result: Detroit’s dissimilarity index fell a dramatic 10 points since 2000, one of the largest decreases nationwide. This good news, however, is only made possible by the broader economic disaster.
“Blacks are fleeing the city and are following the path of least resistance into formerly all-white bastions like Warren and Harper Woods, where houses are often on the market for months or years,” says Sugrue. “But many whites, trapped by the collapsing housing market, are unable to move. Hence a decline in segregation rates.”
In Detroit city, Latinos are the only growing segment of the population. The Mexicantown neighborhood is thriving, with few boarded-up windows, a leafy park and abundant taquerias.
No. 3: Chicago
Main city population: 2,695,598
Metropolitan population: 9,461,105
Segregation level (dissimilarity): 76.43
In Chicago, white counter-protesters attacked open housing marchers, hitting Martin Luther King in the head with a brick. He later said that he had “never seen as much hatred and hostility on the part of so many people.”
“It’s been segregated since before significant black migration to Chicago started in about 1915,” says Lincoln Quillian, a professor of sociology at Northwestern University who researches segregation. “It increased especially after World War II, with the Great Migration of blacks from the South to northern factories. There were only certain parts of the town, on the South Side, open to blacks at the time.”
Like all migrants, blacks often settled among relatives and friends. But once settled, they were barred from moving into neighboring white communities, creating what historian Arnold Hirsch called Chicago’s “second ghetto.” Later on, the relocation of industry was a long-term economic catastrophe for working-class blacks in the city, converting poor neighborhoods on the South and West sides into what Harvard sociologist William Julius Wilson calls “jobless ghettos.”
“Segregation was the result of organized white opposition to the expansion of blacks, including steps to eliminate them as serious competitors for residential areas and jobs,” says Wilson, the author of numerous books on segregation and poverty in Chicago. Later on, white people moved to the suburbs — and took the jobs with them. “Since 1980, over two-thirds of employment growth has occurred outside the central city.”
Chicago’s iconic public housing towers, now demolished, cemented the concentration of black poverty. After the end of de jure segregation in public housing, white city alderman aggressively kept the projects out of their communities.
Meanwhile, Wilson says, Richard J. Daley reinforced segregation by using “the Interstate Highways Act of 1956 to route expressways through impoverished African-American neighborhoods,” including the “14-lane Dan Ryan Expressway, which created a barrier between black and white neighborhoods.”
The city is increasingly diverse, however, with Latinos now making up a full 25 percent of the population. And there are pockets of integration, including the North Side neighborhood of Rogers Park, where a mixture of whites, blacks, Asians and Latinos live.
“It may help that no group feels like there’s a group that runs the neighborhood completely,” says Quillian.
Chicago’s suburbs were also resistant to integration. In Cicero, a suburb just west of the city, thousands of whites attacked a black family moving into the apartment complex in 1951. One activist noted that while whites burned black churches in Mississippi, they burned down black homes in Chicago. The whites who didn’t fight fled (and some did both). Today, Cicero is 87 percent Latino.
“In the 1960s, people were seeing the very evident effect of blockbusting and panic peddling occurring throughout neighborhoods in the city of Chicago, largely on the west side,” says Rob Breymaier, the executive director of the Oak Park Regional Housing Center, which helps to foster integrated housing in a village northwest of Cicero. “The practice of blockbusting and panic peddling is that realtors would parade African-American families through white neighborhoods. Then they would call and say, ‘I don’t know if you saw, but you might want to sell now before housing prices fall.'”
Oak Park was one of a handful of places around the country where progressive whites made common cause with blacks. But in the Chicago area, it’s the exception, not the rule. Today, middle-income blacks are increasingly moving into Chicago’s suburbs. And though Quillian says that there isn’t white flight like there was in the past, many communities appear to be resegregating. The problem now is white avoidance.
No. 2: New York
Main city population: 8,175,133
Metropolitan population: 18,897,109
Segregation level (dissimilarity): 78.04
New York escaped the decay that has struck manufacturing cities across the Northeast and Midwest. But it hasn’t shaken the lines that divide the Rust Belt by race: New York remains the second most segregated metro area in the country.
“Here in the home of limousine liberalism, the first part of the problem is to get anyone to stop talking about ‘diversity’ in the aggregate long enough to acknowledge that municipal and neighborhood segregation didn’t just drop from the sky … and isn’t simply a function of economics or of self-selection,” Craig Gurian, executive director of the Anti-Discrimination Center, says. “Rather [it] was created by explicitly discriminatory conduct on the part of both public and private actors over the course of decades. Patterns, once established, tend to stay in place unless active steps are taken to undo them.”
In 2009, the Obama administration signed a landmark consent decree with Westchester County, which is nearly 80 percent white. A lawsuit filed by the Anti-Discrimination Center had charged the county with misrepresenting its affordable housing efforts to the federal government. The suit received widespread media attention and was seen as a blow to racially and economically exclusive municipalities nationwide. But Gurian says the decree hasn’t been enforced.
“The problem is not just a Westchester problem: Over 1,000 jurisdictions across the country are looking to see whether the federal government will … hold Westchester’s feet to the fire,” he wrote. “It is especially critical that there be enforcement because the Westchester County executive, Rob Astorino, has publicly defied lawful federal authority.”
Resistance to desegregation is hard to overcome. In the 1940s, MetLife refused to rent apartments to blacks in Manhattan’s sprawling Stuyvesant Town development. In the 1980s, Yonkers almost bankrupted itself fighting an effort to build affordable housing on the city’s white east side. New York is also one of two cities, alongside Los Angeles, with sky-high segregation of Latinos.
Ingrid Gould Ellen, an urban planning and public policy professor at New York University, says that New York City is somewhat more integrated than the data would suggest, because it is far denser than most cities. Since census tracts are made up by population, tracts in New York tend to be very small.
“What happens is that we’re not making apples to apples comparisons. The neighborhoods in Atlanta and Houston are 10 times the size of neighborhoods in New York City physically,” she says. “The census tracts are so much smaller, so you’re likely to cross over a number of census tracts every day.”
The daily commute of the average New Yorker also lessens racial isolation. Thanks to the dominance of public transit, intra-city travel tends to be a diverse experience.
“People are much heavier users of public transit than other parts of the country,” says Ellen. “The New York-L.A. comparison: I live down the street from my office but I’m in the subway most days. I’m literally bumping elbows with people from all over the world. Whereas if I’m in L.A., I get in my car in my all white neighborhood, and drive to work. It’s very different.”
No. 1: Milwaukee
Main city population: 594,833
Metropolitan population: 1,555,908
Segregation level (dissimilarity): 81.52
Milwaukee is consistently rated one of the country’s most segregated metro areas. Like Detroit and most places on this list, Milwaukee has been battered by deindustrialization, with segregated urban blacks disproportionately hurt as jobs and the tax base suburbanized and moved away.
“Most of our history is very similar to Chicago, Cleveland or even Baltimore,” says Marc Levine, professor of history and economic development at the University of Wisconsin, Milwaukee. “Every place has had the zoning ordinances, then restrictive covenants, the practices of realtors. The standard history. What makes Milwaukee a little bit different than these other places, which explains why we’re consistently in the top five and often No. 1, in segregation? We have the lowest rate of African-American suburbanization of any of these larger cities.”
Nationwide, blacks have been concentrated in the inner city, far away from where new jobs are created. Yet the case of Milwaukee is extreme: 90 percent of the metro area’s black population lives in the city. Making matters worse, suburban whites are notably hostile to building any form of public transit to connect city people to suburban jobs, further exacerbating segregation’s ill effects.
If you’re wondering if this can somehow, some way, be blamed on union-busting Wisconsin Gov. Scott Walker, the answer is yes. Walker took the lead in a campaign against public transit to connect the suburbs to the city during his time as county executive. He thought the funds would be better spent on highways.
“There is virulent opposition in these exurban counties to any kind of regional transit system, particularly a regional rail system. There have been proposals over the years, but they’re always DOA,” says Levine. “Governor Walker’s big issue as state representative and county executive was ‘Over my dead body light rail,’ and he fought with Milwaukee’s mayor over funds for regional rail. He very much represents that suburban and exurban base.”
Levine has done some fascinating research into Walker’s political base. Of the nation’s 30 largest metro areas, Milwaukee had the biggest partisan vote gap between city and suburb, with city-dwellers supporting Obama 31 points more than suburbanites.
Milwaukee sticks out in another way: Civic boosters have mounted a major campaign to deny the city’s segregation. In 2002, a group of job training researchers at the University of Wisconsin, Milwaukee, released a study contending that nationally recognized measures of segregation are “racially biased” and, using a new measure, argued that Milwaukee was actually the tenth most integrated of the largest 50 cities.
While people everywhere — especially whites — find it hard to talk about race, the methodological contortions undertaken in Milwaukee are striking.
“It’s not really controversial in Milwaukee. No one seriously doubts we’re a highly segregated place. It’s only controversial because this work, which has never been published, never been peer reviewed, and isn’t taken seriously by any academic experts, purported to show something that some local political leaders wanted to tout in order to make Milwaukee look better,” says Levine. “These non-faculty contract researchers got a grant from a local foundation whose president said, ‘I don’t think Milwaukee is really as segregated as all these studies have shown. Can you run some numbers that show that?'”
The Milwaukee Journal Sentinel covered the findings extensively, despite their lack of academic rigor.
“Milwaukee ranks across the board as among the most segregated metropolises in the nation. It has among the highest rates of racial inequality across a whole range of indicators: black-white joblessness, black-white poverty and black-white ownership of businesses. There’s a bit of civic embarrassment and sensitivity to it,” says Levine.
http://www.salon.com/news/politics/war_room/2011/03/29/most_segregated_cities
美国种族隔离最严重的22个城市
译言网sissi_chen于2011-04-02 17:43:53翻译/
[思思序]种族隔离大体可分为两种:①人身隔离或制度隔离。在社会生活各领域,通过建立各个种族集团的平行机关或有色人种的专门部门所实行的分离。如禁止有色人种和白色人种同读一个学校,同住一个房间,同上一个教堂,同葬一个墓地等。②地域隔离。对一定的种族集团在指定地域内实行的分离。如建立保留地、黑人区、犹太区等。两种隔离一般相互结合,同时并用。看看美国哪个城市的种族隔离行为最严重?
自上世纪70年代以来,种族隔离行为虽然有所减少,但在今天这种行为依旧很明显。
例如,在黑人居住的地方,他们的邻居中平均有45%是黑人。如果没有种族隔离,这个比例应该只有13%。
布朗和佛罗里达州立大学教授进行的《2010年人口普查数据和分析》表明,种族隔离行为依旧没有得到很大改善。
约翰洛根(John Logan )和布莱恩斯特尔茨(Brian Stults )发明了一个相异指数,为了消除种族隔离,一组人必须搬家,与陌生人为邻,然后用相异指数来确定这组人中黑人邻居的百分比- 想一下公共校车的例子。
如果相异指数分值在60分以上,种族隔离行为被认为是非常严重。有22个大都市都超过了这个标准。
http://article.yeeyan.org/view/201774/184432
The 22 Most Segregated Cities In America
Gus Lubin and Christine Jenkins
Racial segregation has been declining since the 1970s but it clearly exists.
For example, the average black person lives in a neighborhood that is 45 percent black. Without segregation, his neighborhood would be only 13 percent black.
The slow decline of segregation was revealed in 2010 census data and analysis by professors at Brown and Florida State University.
John Logan and Brian Stults created a dissimilarity index, which identifies the percentage of one group that would have to move to a different neighborhood to eliminate segregation — think busing.
A score above 60 on the dissimilarity index is considered very high segregation. 22 metropolitan areas crossed this threshold.
Data provided by John R. Logan at Brown University and Brian J. Stults at Florida State University. Slides refer to the largest city in a given metro area. A dissimilarity score above 60 is considered very high.
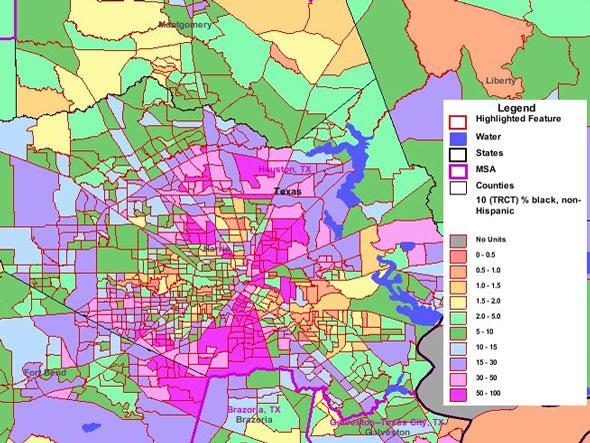
#22 得克萨斯州休斯敦黑白相异得分是60.6。
#22 Houston, Texas has a 60.6 white-black dissimilarity score
Magenta shows tracts that are over 50% black
60.6% of one group would have to move to a different census tract for white-black segregation to be eliminated.
Dissimilarity decreased from 65.1 in 2000; 65.5 in 1990; and 73.7 in 1980.
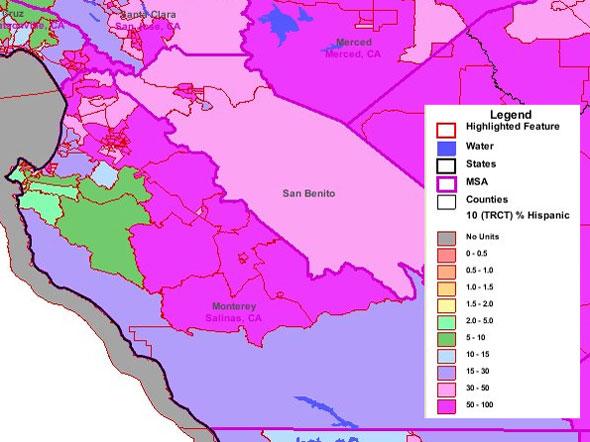
#21 加利福尼亚州萨利纳斯(Salinas)拉美裔和白人相异得分是60.9。
#21 Salinas, Calif. has a 60.9 white-HISPANIC dissimilarity score
Magenta shows tracts that are over 50% Hispanic
60.9% of one group would have to move to a different census tract for white-Hispanic segregation to be eliminated.
Dissimilarity increased from 58.8 in 2000; 56.9 in 1990; and 55.1 in 1980.
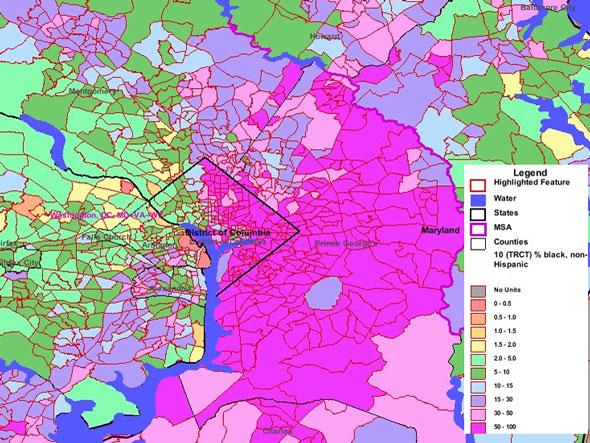
#20 华盛顿特区黑白相异得分是61.0。
#20 Washington D.C. has a 61.0 white-black dissimilarity score
Magenta shows tracts that are over 50% black
61% of one group would have to move to a different census tract for white-black segregation to be eliminated.
Dissimilarity decreased from 63.0 in 2000; 65.5 in 1990; and 69.7 in 1980.
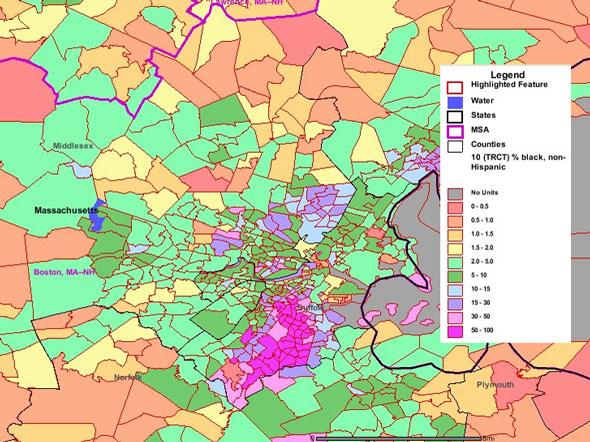
#19 马萨诸塞州波士顿市黑白相异得分是61.5。
#19 Boston, Mass. has a 61.5 white-black dissimilarity score
Magenta shows tracts that are over 50% black
61.5 % of one group would have to move to a different census tract for white-black segregation to be eliminated.
Dissimilarity decreased from 66.0 in 2000; 68.5 in 1990; and 74.6 in 1980.
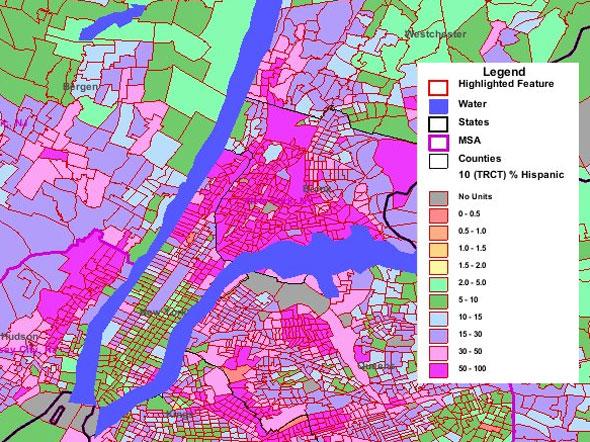
#18 纽约拉美裔和白人相异得分是62.0。
#18 New York has a 62.0 white-HISPANIC dissimilarity score
60.9% of one group would have to move to a different census tract for white-Hispanic segregation to be eliminated.
Dissimilarity increased from 58.8 in 2000; 56.9 in 1990; and 55.1 in 1980.
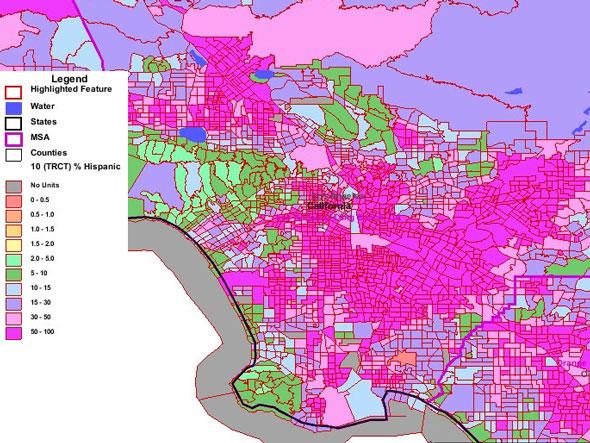
#17 洛杉矶拉美裔和白人相异得分是62.2。
#17 Los Angeles has a 62.2 white-HISPANIC dissimilarity score
Magenta shows tracts that are over 50% Hispanic
62.2% of one group would have to move to a different census tract for white-Hispanic segregation to be eliminated.
Dissimilarity decreased from 62.5 in 2000; but increased from 60.3 in 1990; and 57.1 in 1980.
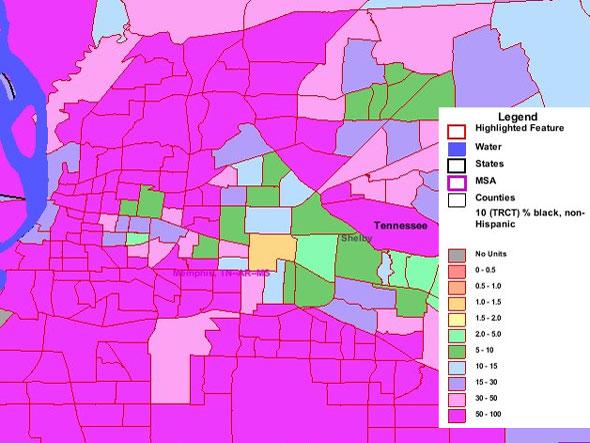
#16 田纳西州孟菲斯(Memphis)黑白相异得分是62.2。
#16 Memphis, Tenn. has a 62.2 white-black dissimilarity score
Magenta shows tracts that are over 50% black
62.2% of one group would have to move to a different census tract for white-black segregation to be eliminated.
Dissimilarity decreased from 65.7 in 2000; 65.5 in 1990; and 68.8 in 1980.
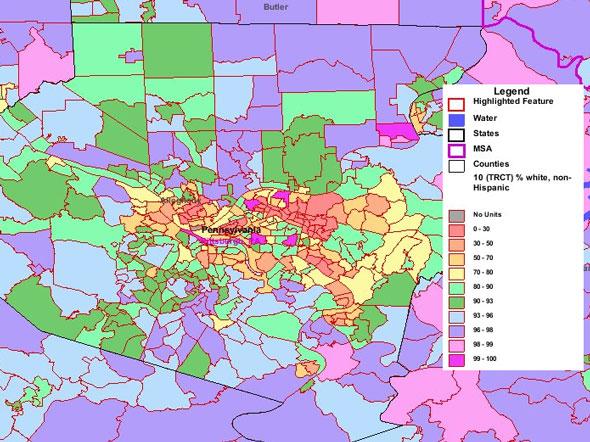
#15 宾夕法尼亚州匹兹堡(Pittsburgh)黑白相异得分是63.1。
#15 Pittsburgh, Pa. has a 63.1 white-black dissimilarity score
Magenta shows tracts that are over 50% black
63.1% of one group would have to move to a different census tract for white-black segregation to be eliminated.
Dissimilarity decreased from 67.4 in 2000; 70.8 in 1990; and 73.3 in 1980.
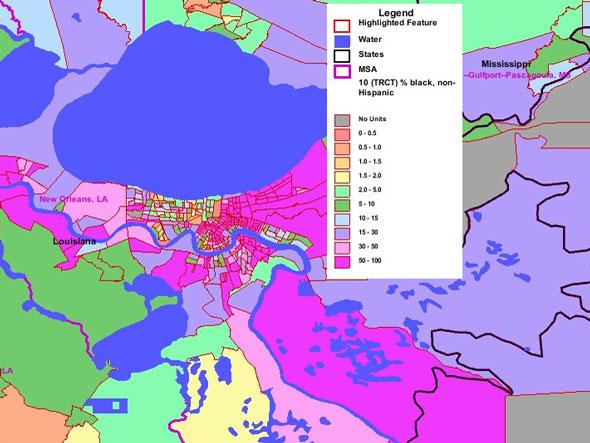
#14 新奥尔良黑白相异得分是63.3。
#14 New Orleans has a 63.3 white-black dissimilarity score
Magenta shows tracts that are over 50% black
63.3% of one group would have to move to a different census tract for white-black segregation to be eliminated.
Dissimilarity decreased from 69.0 in 2000; 68.3 in 1990; and 70.0 in 1980.
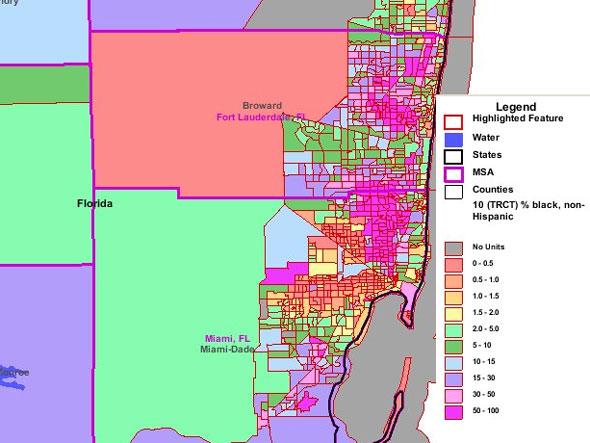
#13 佛罗里达州迈阿密(Miami)黑白相异得分是64。
#13 Miami, Fla. has a 64 white-black dissimilarity score
Magenta shows tracts that are over 50% black
64% of one group would have to move to a different census tract for white-black segregation to be eliminated.
Dissimilarity decreased from 68.5 in 2000; 74 in 1990; and 82.1 in 1980.
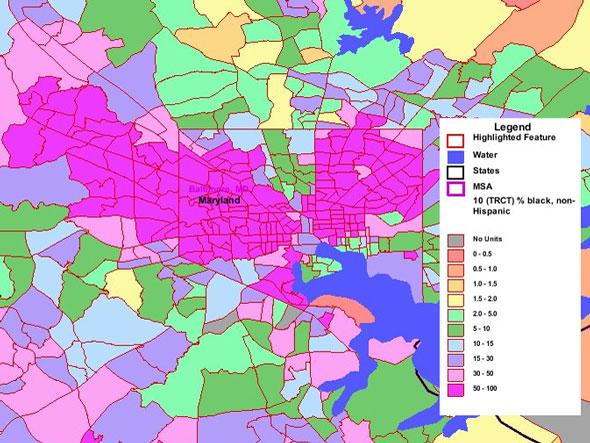
#12 马里兰州巴尔的摩(Baltimore)黑白相异得分是64.3。
#12 Baltimore, Md. has a 64.3 white-black dissimilarity score
Magenta shows tracts that are over 50% black
64.3% of one group would have to move to a different census tract for white-black segregation to be eliminated.
Dissimilarity decreased from 67.6 in 2000; 71.4 in 1990; and 74.4 in 1980.
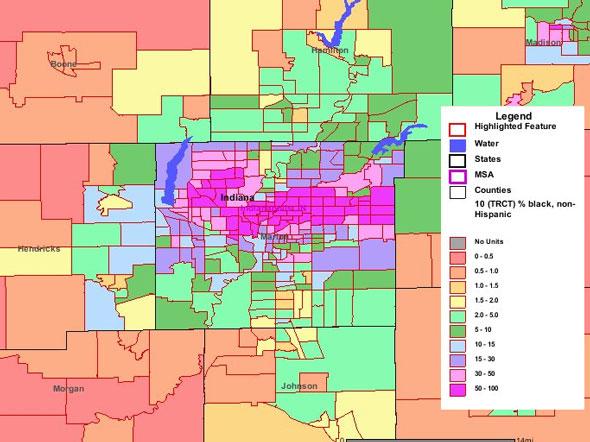
#11 印第安纳州印第安纳波利斯( Indianapolis)黑白相异得分是64.5。
#11 Indianapolis, Ind. has a 64.5 white-black dissimilarity score
Magenta shows tracts that are over 50% black
64.5% of one group would have to move to a different census tract for white-black segregation to be eliminated.
Dissimilarity decreased from 71.0 in 2000; 74.4 in 1990; and 78.8 in 1980.
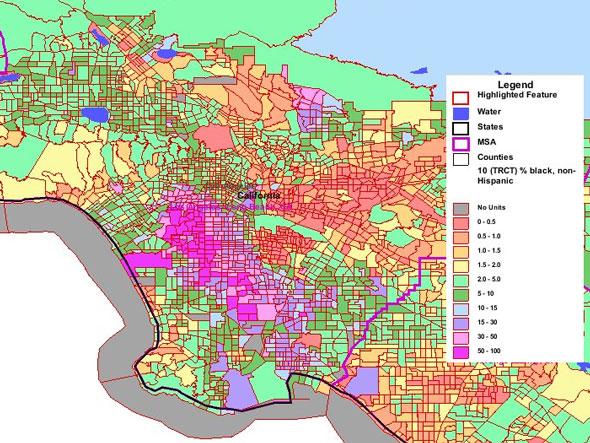
#10 洛杉矶黑白相异得分是65.2。
#10 Los Angeles has a 65.2 white-black dissimilarity score
Magenta shows tracts that are over 50% black
65.2% of one group would have to move to a different census tract for white-black segregation to be eliminated.
Dissimilarity decreased from 68.1 in 2000; 72.8 in 1990; and 81.0 in 1980.
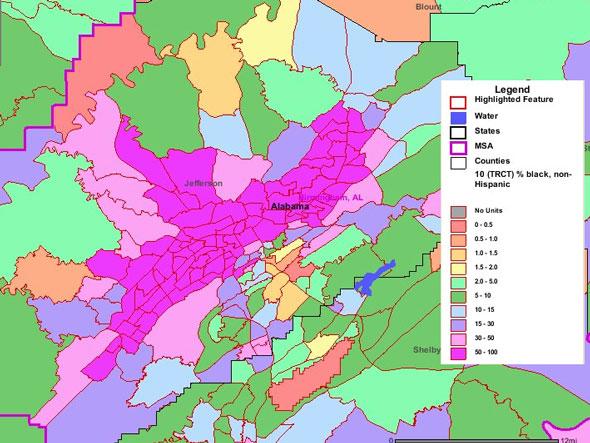
#9 阿拉巴马州伯明翰(Birmingham)黑白相异得分是65.2。
#9 Birmingham, Ala. has a 65.2 white-black dissimilarity score
Magenta shows tracts that are over 50% black
65.2% of one group would have to move to a different census tract for white-black segregation to be eliminated.
Dissimilarity decreased from 68.9 in 2000; 70.3 in 1990; and 72.2 in 1980.
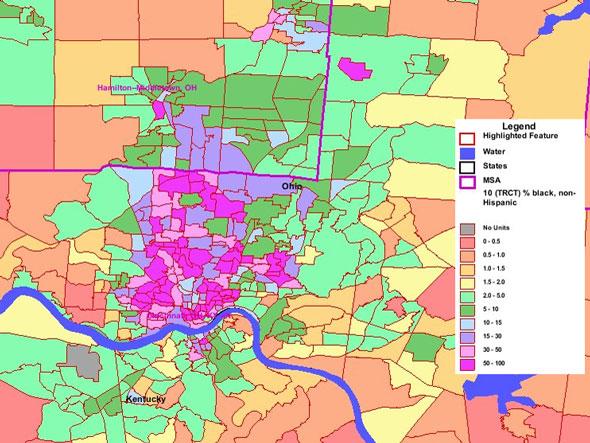
#8 俄亥俄州辛辛那提(Cincinnati)黑白相异得分是66.9。
#8 Cincinnati, Ohio has a 66.9 white-black dissimilarity score
Magenta shows tracts that are over 50% black
66.9% of one group would have to move to a different census tract for white-black segregation to be eliminated.
Dissimilarity decreased from 72.6 in 2000; 75.9 in 1990; and 78.2 in 1980.
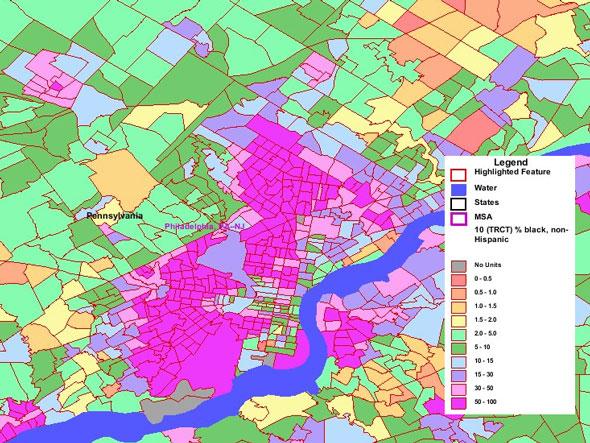
#7 宾夕法尼亚州费城(Philadelphia)黑白相异得分是67。
#7 Philadelphia, Pa. has a 67 white-black dissimilarity score
Magenta shows tracts that are over 50% black
67% of one group would have to move to a different census tract for white-black segregation to be eliminated.
Dissimilarity decreased from 70.3 in 2000; 75.2 in 1990; and 77.2 in 1980.
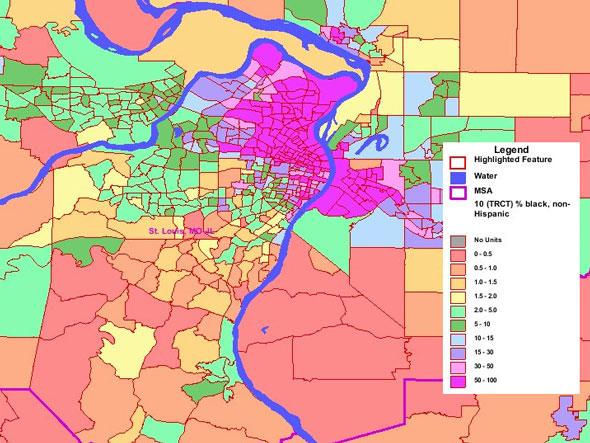
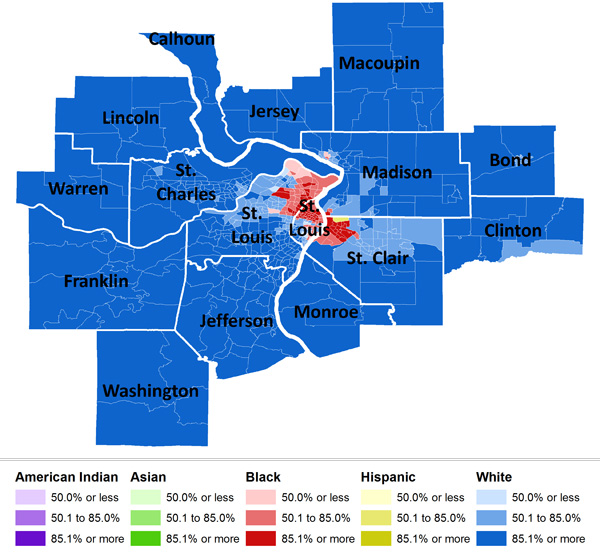
#6 密苏里州圣路易斯(St. Louis)黑白相异得分是70.6。
#6 St. Louis, Mo. has a 70.6 white-black dissimilarity score
Magenta shows tracts that are over 50% black
70.6% of one group would have to move to a different census tract for white-black segregation to be eliminated.
Dissimilarity decreased from 73.4 in 2000; 77.2 in 1990; and 81.6 in 1980.
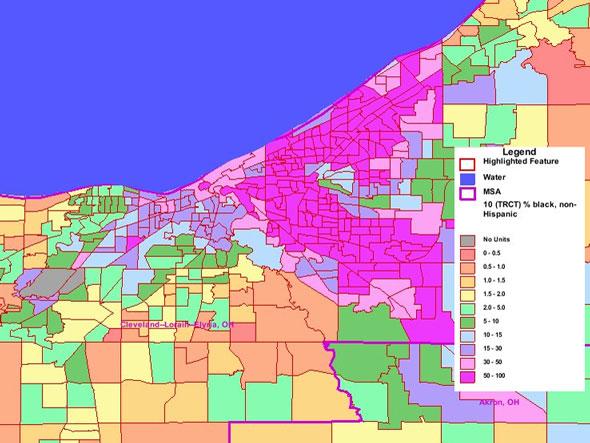
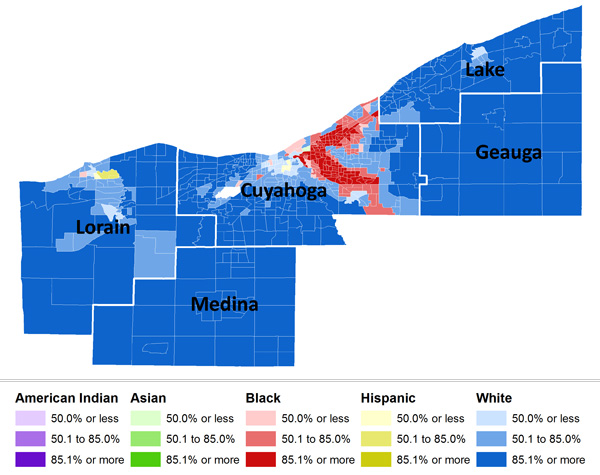
#5 俄亥俄州克里夫兰市(Cleveland)黑白相异得分是72.6。
#5 Cleveland, Ohio has a 72.6 white-black dissimilarity score
Magenta shows tracts that are over 50% black
72.6% of one group would have to move to a different census tract for white-black segregation to be eliminated.
Dissimilarity decreased from 77.2 in 2000; 82.8 in 1990; and 85.8 in 1980.
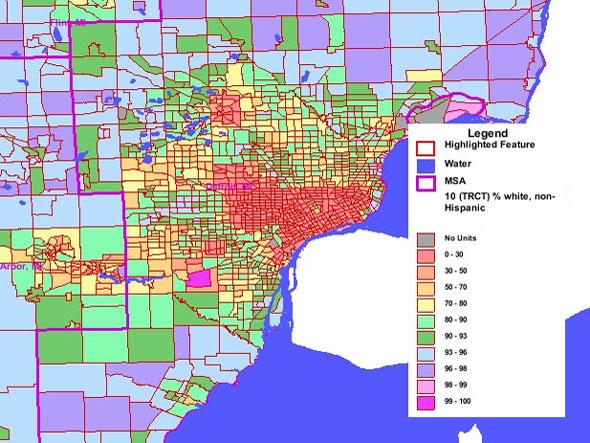
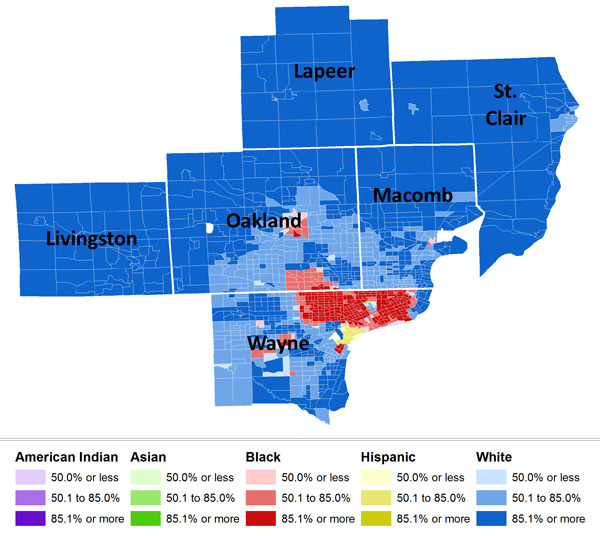
#4 底特律黑白相异得分是74。
#4 Detroit has a 74 white-black dissimilarity score
Magenta shows tracts that are over 50% black
74.0% of one group would have to move to a different census tract for white-black segregation to be eliminated.
Dissimilarity decreased from 84.9 in 2000; 87.6 in 1990; and 87.6 in 1980.
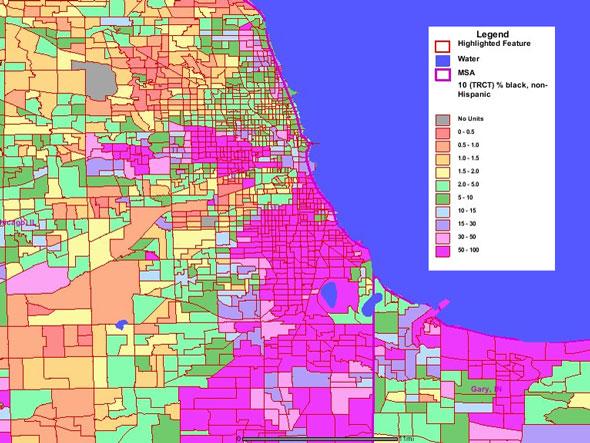
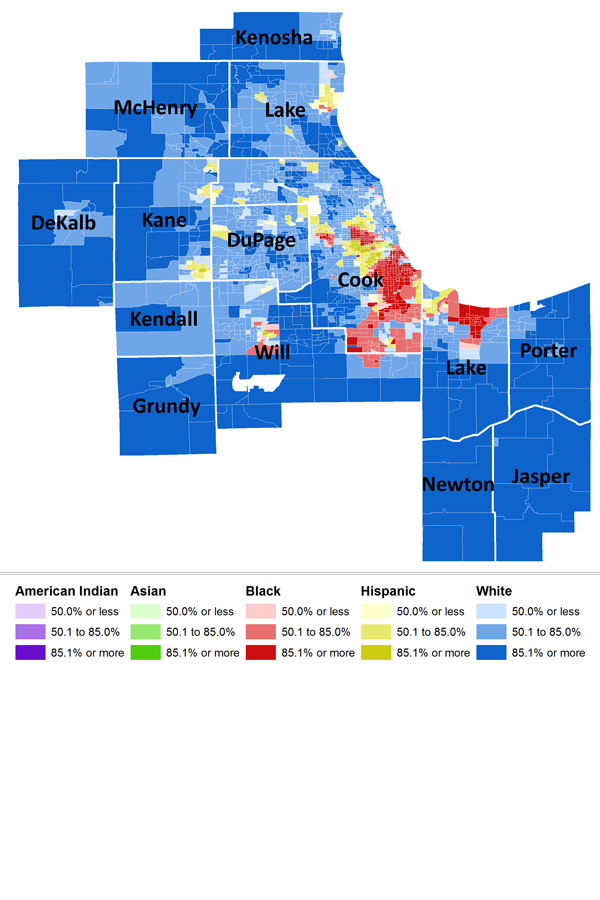
#3 芝加哥黑白相异得分是75.2。
#3 Chicago has a 75.2 white-black dissimilarity score
Magenta shows tracts that are over 50% black
75.2% of one group would have to move to a different census tract for white-black segregation to be eliminated.
Dissimilarity decreased from 80.4 in 2000; 84.4 in 1990; and 88.1 in 1980.
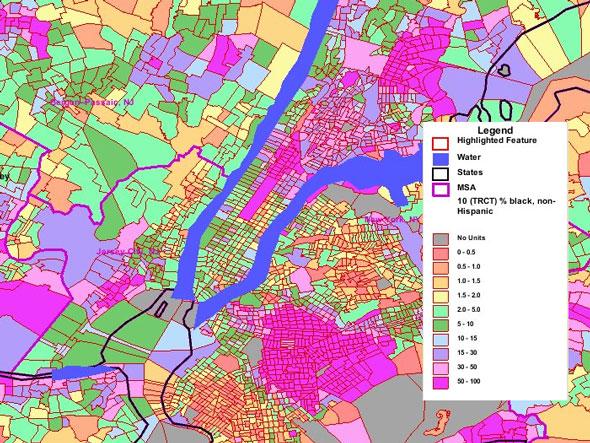
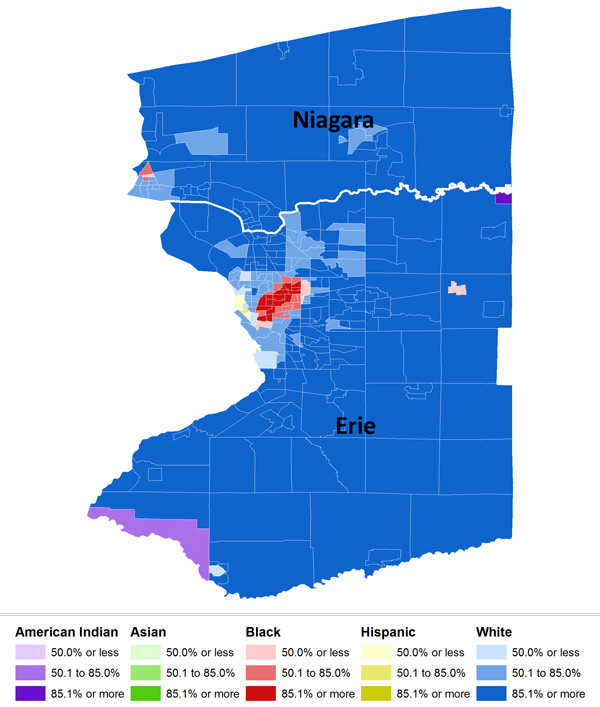
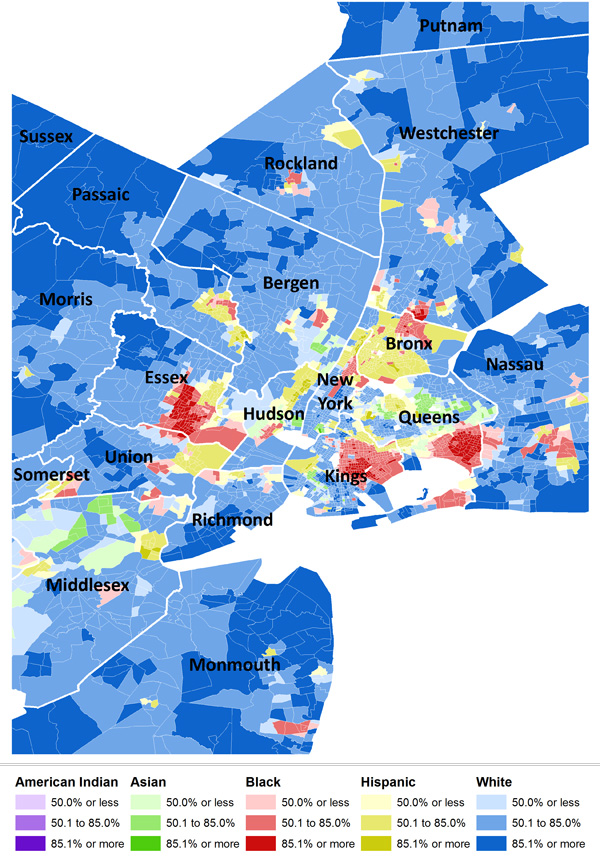
#2 纽约州纽约市黑白相异得分是76.9。
#2 New York City, N.Y. has a 76.9 white-black dissimilarity score
Magenta shows tracts that are over 50% black
79.6% of one group would have to move to a different census tract for white-black segregation to be eliminated.
Dissimilarity decreased from 82.2 in 2000; 82.8 in 1990; and 83.9 in 1980.
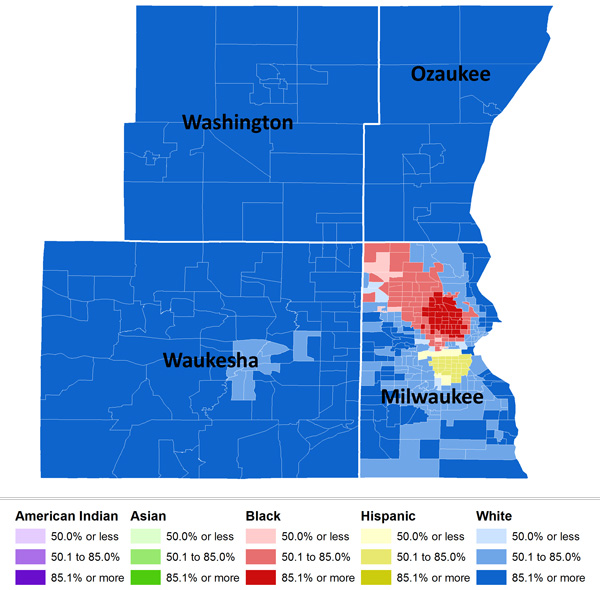
#1 威斯康星州密尔沃基(Milwaukee)黑白相异得分是79.6。
#1 Milwaukee, Wisc. has a 79.6 white-black dissimilarity score
Magenta shows tracts that are over 50% black
79.6% of one group would have to move to a different census tract for white-black segregation to be eliminated.
Dissimilarity decreased from 82.2 in 2000; 82.8 in 1990; and 83.9 in 1980.
http://www.businessinsider.com/most-segregated-cities-in-america-2011-3?op=1